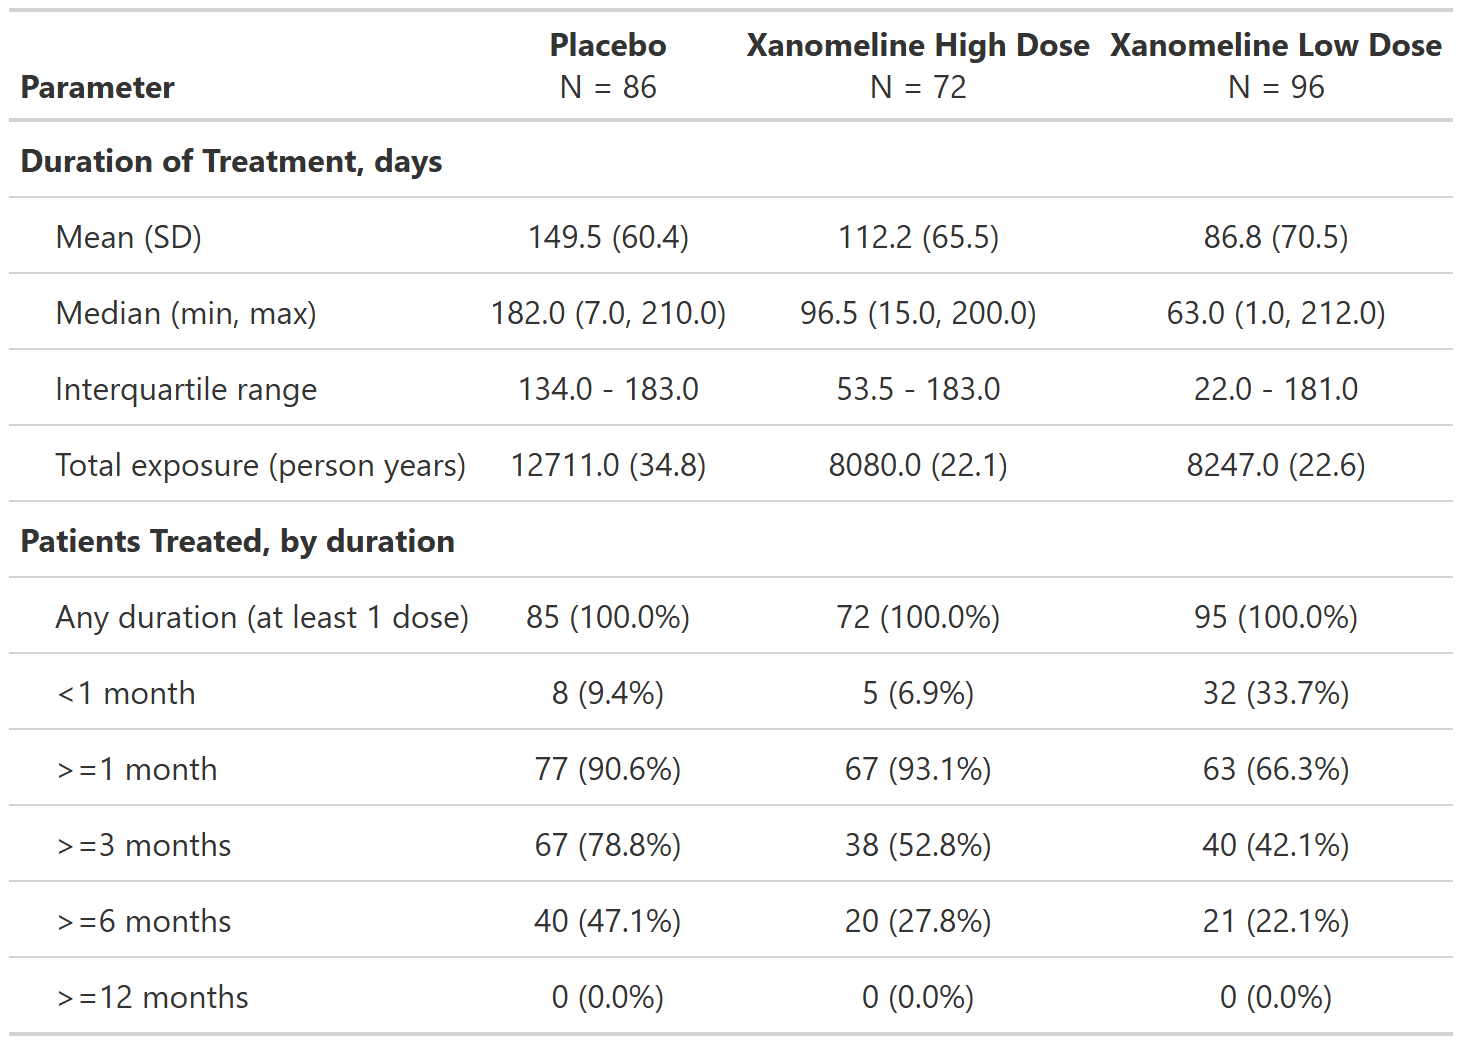
cardinal
  • Home
  • Template Catalog
  • About
  • Resources
  • Help
    • Getting Started
    • Report a Bug
    • FAQ

FDA Table 05

Duration of Treatment Exposure, Safety Population, Pooled Analyses

table
FDA
safety
exposure
  • Table Preview
  • Setup
  • Build ARD
  • Build Table

Code
# Load libraries & data -------------------------------------
library(dplyr)
library(cards)
library(gtsummary)

adsl <- pharmaverseadam::adsl

# Pre-processing --------------------------------------------
data <- adsl %>%
  # Filter for the safety population
  filter(SAFFL == "Y") %>%
  # Calculate treatment duration values
  mutate(TRTDUR = lubridate::interval(.data[["TRTSDTM"]], .data[["TRTEDTM"]])) %>%
  mutate(
    # Get treatment duration values in months (for analysis of patients treated)
    TRTDUR_MONTHS = TRTDUR %>% as.numeric("months"),
    # Specify unit to use for duration of treatment (for analysis of treatment duration)
    TRTDUR = TRTDUR %>% as.numeric("days")
  ) %>%
  # Add one flag variable for each treatment duration range
  mutate(
    D_ANY = TRTDUR_MONTHS > 0, # any duration (at least 1 dose)
    D_LT1 = TRTDUR_MONTHS < 1, # duration <1 month
    D_GT1 = TRTDUR_MONTHS >= 1, # duration >=1 month
    D_GT3 = TRTDUR_MONTHS >= 3, # duration >=3 months
    D_GT6 = TRTDUR_MONTHS >= 6, # duration >=6 months
    D_GT12 = TRTDUR_MONTHS >= 12 # duration >=12 months
  )
Code
# Stack ARD results of two analyses
ard <- data |>
  ard_stack(
    .by = TRT01A,

    # Analysis of treatment duration ----------------------
    ard_continuous(
      variables = TRTDUR,
      statistic = everything() ~ continuous_summary_fns(
        # Specify which default statistics to include
        summaries = c("mean", "sd", "median", "min", "max", "p25", "p75"),
        # Specify custom statistics to include
        other_stats = list(
          # Add total exposure statistic
          tot_exposure = \(x) sum(x),
          # Add total person years statistic (using same unit specified in pre-processing)
          person_yrs = \(x) as.numeric(lubridate::duration(sum(x), "days"), "years")
        )
      )
    ),

    # Analysis of patients treated ------------------------
    ard_dichotomous(
      variables = c(D_ANY, D_LT1, D_GT1, D_GT3, D_GT6, D_GT12),
      # Calculate the n and % statistics for each flag variable
      statistic = everything() ~ c("n", "p")
    )
  )

ard
{cards} data frame: 72 x 11
   group1 group1_level variable variable_level   context    stat_name stat_label     stat fmt_fn warning error
1  TRT01A      Placebo   TRTDUR                continuo…         mean       Mean  149.541      1              
2  TRT01A      Placebo   TRTDUR                continuo…           sd         SD   60.354      1              
3  TRT01A      Placebo   TRTDUR                continuo…       median     Median      182      1              
4  TRT01A      Placebo   TRTDUR                continuo…          min        Min        7      1              
5  TRT01A      Placebo   TRTDUR                continuo…          max        Max      210      1              
6  TRT01A      Placebo   TRTDUR                continuo…          p25         Q1      134      1              
7  TRT01A      Placebo   TRTDUR                continuo…          p75         Q3      183      1              
8  TRT01A      Placebo   TRTDUR                continuo… tot_exposure  tot_expo…    12711      1              
9  TRT01A      Placebo   TRTDUR                continuo…   person_yrs  person_y…   34.801      1              
10 TRT01A      Placebo    D_ANY           TRUE dichotom…            n          n       85      0              
11 TRT01A      Placebo    D_ANY           TRUE dichotom…            p          %        1   <fn>              
12 TRT01A      Placebo    D_LT1           TRUE dichotom…            n          n        8      0              
13 TRT01A      Placebo    D_LT1           TRUE dichotom…            p          %    0.094   <fn>              
14 TRT01A      Placebo    D_GT1           TRUE dichotom…            n          n       77      0              
15 TRT01A      Placebo    D_GT1           TRUE dichotom…            p          %    0.906   <fn>              
16 TRT01A      Placebo    D_GT3           TRUE dichotom…            n          n       67      0              
17 TRT01A      Placebo    D_GT3           TRUE dichotom…            p          %    0.788   <fn>              
18 TRT01A      Placebo    D_GT6           TRUE dichotom…            n          n       40      0              
19 TRT01A      Placebo    D_GT6           TRUE dichotom…            p          %    0.471   <fn>              
20 TRT01A      Placebo   D_GT12           TRUE dichotom…            n          n        0      0              
21 TRT01A      Placebo   D_GT12           TRUE dichotom…            p          %        0   <fn>              
22 TRT01A    Xanomeli…   TRTDUR                continuo…         mean       Mean  112.222      1              
23 TRT01A    Xanomeli…   TRTDUR                continuo…           sd         SD   65.523      1              
24 TRT01A    Xanomeli…   TRTDUR                continuo…       median     Median     96.5      1              
25 TRT01A    Xanomeli…   TRTDUR                continuo…          min        Min       15      1              
26 TRT01A    Xanomeli…   TRTDUR                continuo…          max        Max      200      1              
27 TRT01A    Xanomeli…   TRTDUR                continuo…          p25         Q1     53.5      1              
28 TRT01A    Xanomeli…   TRTDUR                continuo…          p75         Q3      183      1              
29 TRT01A    Xanomeli…   TRTDUR                continuo… tot_exposure  tot_expo… 8079.999      1              
30 TRT01A    Xanomeli…   TRTDUR                continuo…   person_yrs  person_y…   22.122      1              
31 TRT01A    Xanomeli…    D_ANY           TRUE dichotom…            n          n       72      0              
32 TRT01A    Xanomeli…    D_ANY           TRUE dichotom…            p          %        1   <fn>              
33 TRT01A    Xanomeli…    D_LT1           TRUE dichotom…            n          n        5      0              
34 TRT01A    Xanomeli…    D_LT1           TRUE dichotom…            p          %    0.069   <fn>              
35 TRT01A    Xanomeli…    D_GT1           TRUE dichotom…            n          n       67      0              
36 TRT01A    Xanomeli…    D_GT1           TRUE dichotom…            p          %    0.931   <fn>              
37 TRT01A    Xanomeli…    D_GT3           TRUE dichotom…            n          n       38      0              
38 TRT01A    Xanomeli…    D_GT3           TRUE dichotom…            p          %    0.528   <fn>              
39 TRT01A    Xanomeli…    D_GT6           TRUE dichotom…            n          n       20      0              
40 TRT01A    Xanomeli…    D_GT6           TRUE dichotom…            p          %    0.278   <fn>              
ℹ 32 more rows
ℹ Use `print(n = ...)` to see more rows
Code
# Use info from the ARD previously generated to create a table
tbl <- tbl_ard_summary(
  ard,
  by = TRT01A,
  # Use type "continuous2" to display statistics on separate lines
  type = list(TRTDUR = "continuous2"),
  # Specify summary statistics to display for treatment duration variable
  statistic = all_continuous() ~ c(
    "{mean} ({sd})", "{median} ({min}, {max})",
    iqr = "{p25} - {p75}", "{tot_exposure} ({person_yrs})"
  ),
  # Add descriptive labels for each variable
  label =
    list(
      TRTDUR = "Duration of Treatment, days",
      D_ANY = "Any duration (at least 1 dose)",
      D_LT1 = "<1 month",
      D_GT1 = ">=1 month",
      D_GT3 = ">=3 months",
      D_GT6 = ">=6 months",
      D_GT12 = ">=12 months"
    )
) |>
  # Add custom statistic labels for treatment duration variable, keep other stat labels as is
  add_stat_label(
    label = list(
      TRTDUR ~ c("Mean (SD)", "Median (min, max)", "Interquartile range", "Total exposure (person years)"),
      all_dichotomous() ~ NA_character_
    )
  ) |>
  # Add label over analysis of group of flag variables
  add_variable_group_header("Patients Treated, by duration", all_dichotomous()) |>
  # Update header labels
  modify_header(
    label ~ "**Parameter**",
    all_stat_cols() ~ "**{level}**  \nN = {n}"
  ) |>
  # bold text in the two label rows
  modify_bold(
    rows = (variable == "TRTDUR" & row_type == "label") | (row_type == "variable_group"),
    columns = label
  )

tbl

Source Code
---
title: FDA Table 05
subtitle: Duration of Treatment Exposure, Safety Population, Pooled Analyses
categories: [table, FDA, safety, exposure]
---

::: panel-tabset
## Table Preview

```{r img, echo=FALSE, fig.align='center', out.width='60%'}
knitr::include_graphics("result.png")
```

## Setup

```{r setup, message=FALSE}
# Load libraries & data -------------------------------------
library(dplyr)
library(cards)
library(gtsummary)

adsl <- pharmaverseadam::adsl

# Pre-processing --------------------------------------------
data <- adsl %>%
  # Filter for the safety population
  filter(SAFFL == "Y") %>%
  # Calculate treatment duration values
  mutate(TRTDUR = lubridate::interval(.data[["TRTSDTM"]], .data[["TRTEDTM"]])) %>%
  mutate(
    # Get treatment duration values in months (for analysis of patients treated)
    TRTDUR_MONTHS = TRTDUR %>% as.numeric("months"),
    # Specify unit to use for duration of treatment (for analysis of treatment duration)
    TRTDUR = TRTDUR %>% as.numeric("days")
  ) %>%
  # Add one flag variable for each treatment duration range
  mutate(
    D_ANY = TRTDUR_MONTHS > 0, # any duration (at least 1 dose)
    D_LT1 = TRTDUR_MONTHS < 1, # duration <1 month
    D_GT1 = TRTDUR_MONTHS >= 1, # duration >=1 month
    D_GT3 = TRTDUR_MONTHS >= 3, # duration >=3 months
    D_GT6 = TRTDUR_MONTHS >= 6, # duration >=6 months
    D_GT12 = TRTDUR_MONTHS >= 12 # duration >=12 months
  )
```

## Build ARD

```{r ard, message=FALSE, warning=FALSE, results='hide'}
# Stack ARD results of two analyses
ard <- data |>
  ard_stack(
    .by = TRT01A,

    # Analysis of treatment duration ----------------------
    ard_continuous(
      variables = TRTDUR,
      statistic = everything() ~ continuous_summary_fns(
        # Specify which default statistics to include
        summaries = c("mean", "sd", "median", "min", "max", "p25", "p75"),
        # Specify custom statistics to include
        other_stats = list(
          # Add total exposure statistic
          tot_exposure = \(x) sum(x),
          # Add total person years statistic (using same unit specified in pre-processing)
          person_yrs = \(x) as.numeric(lubridate::duration(sum(x), "days"), "years")
        )
      )
    ),

    # Analysis of patients treated ------------------------
    ard_dichotomous(
      variables = c(D_ANY, D_LT1, D_GT1, D_GT3, D_GT6, D_GT12),
      # Calculate the n and % statistics for each flag variable
      statistic = everything() ~ c("n", "p")
    )
  )

ard
```

```{r, echo=FALSE}
# Print ARD
withr::local_options(width = 9999)
print(ard, columns = "all", n = 40)
```

## Build Table

```{r tbl, results = 'hide'}
# Use info from the ARD previously generated to create a table
tbl <- tbl_ard_summary(
  ard,
  by = TRT01A,
  # Use type "continuous2" to display statistics on separate lines
  type = list(TRTDUR = "continuous2"),
  # Specify summary statistics to display for treatment duration variable
  statistic = all_continuous() ~ c(
    "{mean} ({sd})", "{median} ({min}, {max})",
    iqr = "{p25} - {p75}", "{tot_exposure} ({person_yrs})"
  ),
  # Add descriptive labels for each variable
  label =
    list(
      TRTDUR = "Duration of Treatment, days",
      D_ANY = "Any duration (at least 1 dose)",
      D_LT1 = "<1 month",
      D_GT1 = ">=1 month",
      D_GT3 = ">=3 months",
      D_GT6 = ">=6 months",
      D_GT12 = ">=12 months"
    )
) |>
  # Add custom statistic labels for treatment duration variable, keep other stat labels as is
  add_stat_label(
    label = list(
      TRTDUR ~ c("Mean (SD)", "Median (min, max)", "Interquartile range", "Total exposure (person years)"),
      all_dichotomous() ~ NA_character_
    )
  ) |>
  # Add label over analysis of group of flag variables
  add_variable_group_header("Patients Treated, by duration", all_dichotomous()) |>
  # Update header labels
  modify_header(
    label ~ "**Parameter**",
    all_stat_cols() ~ "**{level}**  \nN = {n}"
  ) |>
  # bold text in the two label rows
  modify_bold(
    rows = (variable == "TRTDUR" & row_type == "label") | (row_type == "variable_group"),
    columns = label
  )

tbl
```

```{r eval=FALSE, include=FALSE}
# Run chunk locally to generate image file
gt::gtsave(as_gt(tbl), filename = "result.png")
```

```{r img, echo=FALSE, fig.align='center', out.width='60%'}
```
:::
 
  • This website as well as code examples are licensed under the Apache License, Version 2.0.
Cookie Preferences