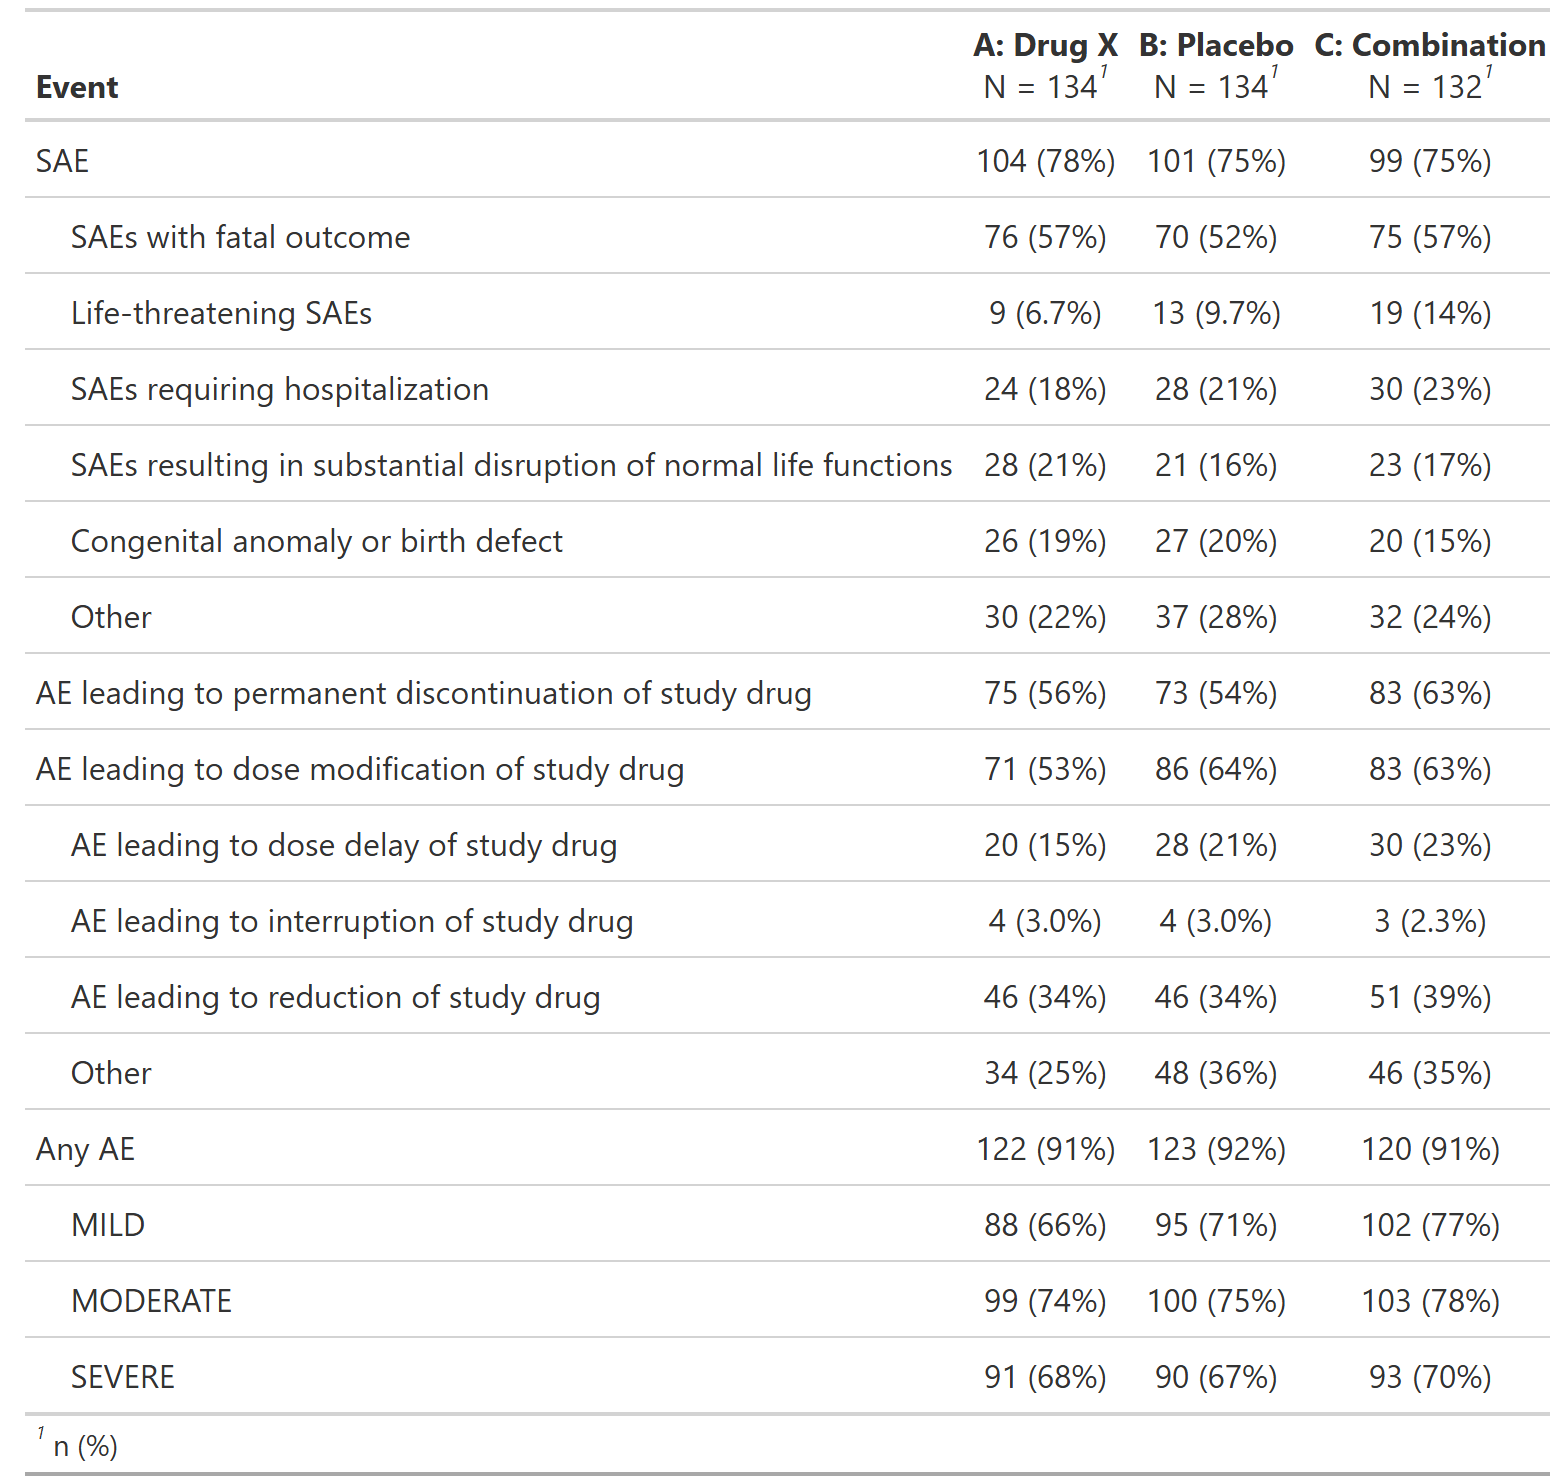
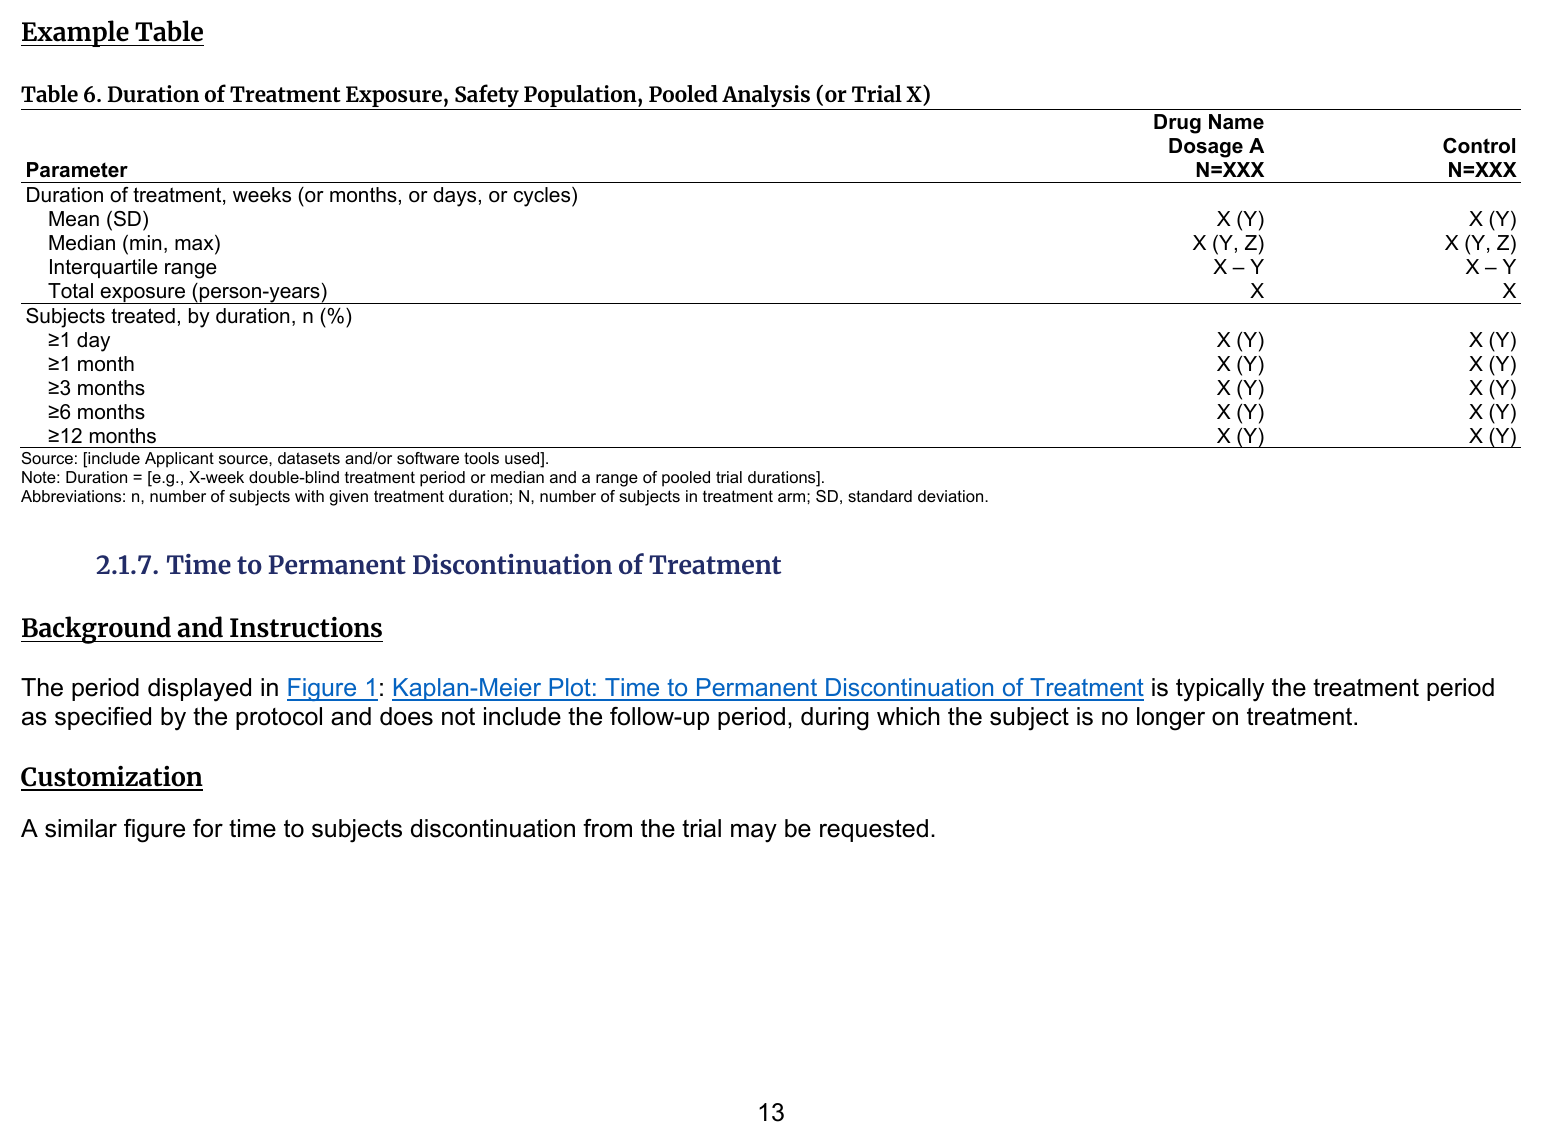
Duration of Treatment Exposure, Safety Population, Pooled Analysis (or Trial X)
FDA Table 06
table
FDA
safety
exposure
FDA IG Shell
Programming Notes
Background and Instructions
Customization
Discuss appropriate time points for duration of treatment with the CDS. Consider adding metrics such as dose intensity and relative dose intensity as appropriate (e.g., for oncology trials or studies):
• Dose intensity is the total amount of drug given in a fixed unit of time (usually 1 week), and thus is a function of dose and frequency of administration.
• Relative dose intensity is the ratio of “delivered” to the “planned” dose intensity and can be expressed as a percentage. A relative dose intensity of 100% indicates that the drug was administered at the dose planned per protocol, without delay, and without cancellations.
Output
Code
# FDA TABLE 06 ---------------------------------------------------------------
# Self-contained template. Run top-to-bottom to build the objects below.
# Used by tests via run_template() and published in the catalog.

library(dplyr)
library(cards)
library(gtsummary)

adsl <- pharmaverseadam::adsl |>
  filter(TRT01A != "Screen Failure") # Remove screening failure observations

# Pre-processing --------------------------------------------
data <- adsl |>
  # Filter for the safety population
  filter(SAFFL == "Y") |>
  # Calculate treatment duration values
  mutate(TRTDUR = lubridate::interval(.data[["TRTSDTM"]], .data[["TRTEDTM"]])) |>
  mutate(
    # Get treatment duration values in months (for analysis of subjects treated)
    TRTDUR_MONTHS = TRTDUR |> as.numeric("months"),
    # Specify unit to use for duration of treatment (for analysis of treatment duration)
    TRTDUR = TRTDUR |> as.numeric("days")
  ) |>
  # Add one flag variable for each treatment duration range
  mutate(
    D_ANY = TRTDUR >= 1, # duration >=1 day
    D_GT1 = TRTDUR_MONTHS >= 1, # duration >=1 month
    D_GT3 = TRTDUR_MONTHS >= 3, # duration >=3 months
    D_GT6 = TRTDUR_MONTHS >= 6, # duration >=6 months
    D_GT12 = TRTDUR_MONTHS >= 12 # duration >=12 months
  )

# Stack ARD results of two analyses
ard <- data |>
  ard_stack(
    .by = TRT01A,

    # Analysis of treatment duration ----------------------
    ard_summary(
      variables = TRTDUR,
      statistic = everything() ~ continuous_summary_fns(
        # Specify which default statistics to include
        summaries = c("mean", "sd", "median", "min", "max", "p25", "p75"),
        # Specify custom statistics to include
        other_stats = list(
          # Add total exposure statistic
          tot_exposure = \(x) sum(x),
          # Add total person years statistic (using same unit specified in pre-processing)
          person_yrs = \(x) as.numeric(lubridate::duration(sum(x), "days"), "years")
        )
      )
    ),

    # Analysis of subjects treated ------------------------
    ard_tabulate_value(
      variables = c(D_ANY, D_GT1, D_GT3, D_GT6, D_GT12),
      # Calculate the n and % statistics for each flag variable
      statistic = everything() ~ c("n", "p")
    )
  )

# Use info from the ARD previously generated to create a table
tbl <- tbl_ard_summary(
  ard,
  by = TRT01A,
  # Use type "continuous2" to display statistics on separate lines
  type = list(TRTDUR = "continuous2"),
  # Specify summary statistics to display for treatment duration variable
  statistic = all_continuous() ~ c(
    "{mean} ({sd})", "{median} ({min}, {max})",
    iqr = "{p25} - {p75}", "{tot_exposure} ({person_yrs})"
  ),
  # Add descriptive labels for each variable
  label =
    list(
      TRTDUR = "Duration of Treatment, days",
      D_ANY = ">= 1 day",
      D_GT1 = ">=1 month",
      D_GT3 = ">=3 months",
      D_GT6 = ">=6 months",
      D_GT12 = ">=12 months"
    )
) |>
  # Add custom statistic labels for treatment duration variable, keep other stat labels as is
  add_stat_label(
    label = list(
      TRTDUR ~ c("Mean (SD)", "Median (min, max)", "Interquartile range", "Total exposure (person-years)"),
      all_dichotomous() ~ NA_character_
    )
  ) |>
  # Add label over analysis of group of flag variables
  add_variable_group_header("Subjects Treated, by duration, n (%)", all_dichotomous()) |>
  # Update header labels
  modify_header(
    label ~ "**Parameter**",
    all_stat_cols() ~ "**{level}**  \nN = {n}"
  )


ard <- gtsummary::gather_ard(tbl)| Parameter |
Placebo N = 86 |
Xanomeline High Dose N = 72 |
Xanomeline Low Dose N = 96 |
|---|---|---|---|
| Duration of Treatment, days | |||
| Mean (SD) | 149.5 (60.4) | 112.2 (65.5) | 86.8 (70.5) |
| Median (min, max) | 182.0 (7.0, 210.0) | 96.5 (15.0, 200.0) | 63.0 (1.0, 212.0) |
| Interquartile range | 134.0 - 183.0 | 53.5 - 183.0 | 22.0 - 181.0 |
| Total exposure (person-years) | 12711.0 (34.8) | 8080.0 (22.1) | 8247.0 (22.6) |
| Subjects Treated, by duration, n (%) | |||
| >= 1 day | 85 (100.0%) | 72 (100.0%) | 94 (98.9%) |
| >=1 month | 77 (90.6%) | 67 (93.1%) | 63 (66.3%) |
| >=3 months | 67 (78.8%) | 38 (52.8%) | 40 (42.1%) |
| >=6 months | 40 (47.1%) | 20 (27.8%) | 21 (22.1%) |
| >=12 months | 0 (0.0%) | 0 (0.0%) | 0 (0.0%) |
$tbl_ard_summary
# An ARD data frame: 78 × 12
group1 group1_level variable variable_level context stat_name stat_label stat fmt_fun warning error gts_column
<chr> <list> <chr> <list> <chr> <chr> <chr> <list> <list> <list> <list> <chr>
1 TRT01A Placebo TRTDUR <NULL> summary mean Mean 149.5412 1 <NULL> <NULL> stat_1
2 TRT01A Placebo TRTDUR <NULL> summary sd SD 60.35442 1 <NULL> <NULL> stat_1
3 TRT01A Placebo TRTDUR <NULL> summary median Median 182 1 <NULL> <NULL> stat_1
4 TRT01A Placebo TRTDUR <NULL> summary min Min 6.999988 1 <NULL> <NULL> stat_1
5 TRT01A Placebo TRTDUR <NULL> summary max Max 210 1 <NULL> <NULL> stat_1
6 TRT01A Placebo TRTDUR <NULL> summary p25 Q1 134 1 <NULL> <NULL> stat_1
7 TRT01A Placebo TRTDUR <NULL> summary p75 Q3 183 1 <NULL> <NULL> stat_1
8 TRT01A Placebo TRTDUR <NULL> summary tot_exposure tot_exposure 12711 1 <NULL> <NULL> stat_1
9 TRT01A Placebo TRTDUR <NULL> summary person_yrs person_yrs 34.80082 1 <NULL> <NULL> stat_1
10 TRT01A Placebo D_ANY TRUE tabulate_value n n 85 0 <NULL> <NULL> stat_1
11 TRT01A Placebo D_ANY TRUE tabulate_value p % 1 <fn> <NULL> <NULL> stat_1
12 TRT01A Placebo D_GT1 TRUE tabulate_value n n 77 0 <NULL> <NULL> stat_1
13 TRT01A Placebo D_GT1 TRUE tabulate_value p % 0.9058824 <fn> <NULL> <NULL> stat_1
14 TRT01A Placebo D_GT3 TRUE tabulate_value n n 67 0 <NULL> <NULL> stat_1
15 TRT01A Placebo D_GT3 TRUE tabulate_value p % 0.7882353 <fn> <NULL> <NULL> stat_1
16 TRT01A Placebo D_GT6 TRUE tabulate_value n n 40 0 <NULL> <NULL> stat_1
17 TRT01A Placebo D_GT6 TRUE tabulate_value p % 0.4705882 <fn> <NULL> <NULL> stat_1
18 TRT01A Placebo D_GT12 TRUE tabulate_value n n 0 0 <NULL> <NULL> stat_1
19 TRT01A Placebo D_GT12 TRUE tabulate_value p % 0 <fn> <NULL> <NULL> stat_1
20 TRT01A Xanomeline High Dose TRTDUR <NULL> summary mean Mean 112.2222 1 <NULL> <NULL> stat_2
21 TRT01A Xanomeline High Dose TRTDUR <NULL> summary sd SD 65.52329 1 <NULL> <NULL> stat_2
22 TRT01A Xanomeline High Dose TRTDUR <NULL> summary median Median 96.49999 1 <NULL> <NULL> stat_2
23 TRT01A Xanomeline High Dose TRTDUR <NULL> summary min Min 14.99999 1 <NULL> <NULL> stat_2
24 TRT01A Xanomeline High Dose TRTDUR <NULL> summary max Max 200 1 <NULL> <NULL> stat_2
25 TRT01A Xanomeline High Dose TRTDUR <NULL> summary p25 Q1 53.49999 1 <NULL> <NULL> stat_2
26 TRT01A Xanomeline High Dose TRTDUR <NULL> summary p75 Q3 183 1 <NULL> <NULL> stat_2
27 TRT01A Xanomeline High Dose TRTDUR <NULL> summary tot_exposure tot_exposure 8079.999 1 <NULL> <NULL> stat_2
28 TRT01A Xanomeline High Dose TRTDUR <NULL> summary person_yrs person_yrs 22.12183 1 <NULL> <NULL> stat_2
29 TRT01A Xanomeline High Dose D_ANY TRUE tabulate_value n n 72 0 <NULL> <NULL> stat_2
30 TRT01A Xanomeline High Dose D_ANY TRUE tabulate_value p % 1 <fn> <NULL> <NULL> stat_2
31 TRT01A Xanomeline High Dose D_GT1 TRUE tabulate_value n n 67 0 <NULL> <NULL> stat_2
32 TRT01A Xanomeline High Dose D_GT1 TRUE tabulate_value p % 0.9305556 <fn> <NULL> <NULL> stat_2
33 TRT01A Xanomeline High Dose D_GT3 TRUE tabulate_value n n 38 0 <NULL> <NULL> stat_2
34 TRT01A Xanomeline High Dose D_GT3 TRUE tabulate_value p % 0.5277778 <fn> <NULL> <NULL> stat_2
35 TRT01A Xanomeline High Dose D_GT6 TRUE tabulate_value n n 20 0 <NULL> <NULL> stat_2
36 TRT01A Xanomeline High Dose D_GT6 TRUE tabulate_value p % 0.2777778 <fn> <NULL> <NULL> stat_2
37 TRT01A Xanomeline High Dose D_GT12 TRUE tabulate_value n n 0 0 <NULL> <NULL> stat_2
38 TRT01A Xanomeline High Dose D_GT12 TRUE tabulate_value p % 0 <fn> <NULL> <NULL> stat_2
39 TRT01A Xanomeline Low Dose TRTDUR <NULL> summary mean Mean 86.81051 1 <NULL> <NULL> stat_3
40 TRT01A Xanomeline Low Dose TRTDUR <NULL> summary sd SD 70.47367 1 <NULL> <NULL> stat_3
41 TRT01A Xanomeline Low Dose TRTDUR <NULL> summary median Median 62.99999 1 <NULL> <NULL> stat_3
42 TRT01A Xanomeline Low Dose TRTDUR <NULL> summary min Min 0.9999884 1 <NULL> <NULL> stat_3
43 TRT01A Xanomeline Low Dose TRTDUR <NULL> summary max Max 212 1 <NULL> <NULL> stat_3
44 TRT01A Xanomeline Low Dose TRTDUR <NULL> summary p25 Q1 21.99999 1 <NULL> <NULL> stat_3
45 TRT01A Xanomeline Low Dose TRTDUR <NULL> summary p75 Q3 181 1 <NULL> <NULL> stat_3
46 TRT01A Xanomeline Low Dose TRTDUR <NULL> summary tot_exposure tot_exposure 8246.999 1 <NULL> <NULL> stat_3
47 TRT01A Xanomeline Low Dose TRTDUR <NULL> summary person_yrs person_yrs 22.57905 1 <NULL> <NULL> stat_3
48 TRT01A Xanomeline Low Dose D_ANY TRUE tabulate_value n n 94 0 <NULL> <NULL> stat_3
49 TRT01A Xanomeline Low Dose D_ANY TRUE tabulate_value p % 0.9894737 <fn> <NULL> <NULL> stat_3
50 TRT01A Xanomeline Low Dose D_GT1 TRUE tabulate_value n n 63 0 <NULL> <NULL> stat_3
51 TRT01A Xanomeline Low Dose D_GT1 TRUE tabulate_value p % 0.6631579 <fn> <NULL> <NULL> stat_3
52 TRT01A Xanomeline Low Dose D_GT3 TRUE tabulate_value n n 40 0 <NULL> <NULL> stat_3
53 TRT01A Xanomeline Low Dose D_GT3 TRUE tabulate_value p % 0.4210526 <fn> <NULL> <NULL> stat_3
54 TRT01A Xanomeline Low Dose D_GT6 TRUE tabulate_value n n 21 0 <NULL> <NULL> stat_3
55 TRT01A Xanomeline Low Dose D_GT6 TRUE tabulate_value p % 0.2210526 <fn> <NULL> <NULL> stat_3
56 TRT01A Xanomeline Low Dose D_GT12 TRUE tabulate_value n n 0 0 <NULL> <NULL> stat_3
57 TRT01A Xanomeline Low Dose D_GT12 TRUE tabulate_value p % 0 <fn> <NULL> <NULL> stat_3
58 <NA> <NULL> TRT01A Placebo tabulate n n 86 0 <NULL> <NULL> <NA>
59 <NA> <NULL> TRT01A Placebo tabulate N N 254 0 <NULL> <NULL> <NA>
60 <NA> <NULL> TRT01A Placebo tabulate p % 0.3385827 <fn> <NULL> <NULL> <NA>
61 <NA> <NULL> TRT01A Xanomeline High Dose tabulate n n 72 0 <NULL> <NULL> <NA>
62 <NA> <NULL> TRT01A Xanomeline High Dose tabulate N N 254 0 <NULL> <NULL> <NA>
63 <NA> <NULL> TRT01A Xanomeline High Dose tabulate p % 0.2834646 <fn> <NULL> <NULL> <NA>
64 <NA> <NULL> TRT01A Xanomeline Low Dose tabulate n n 96 0 <NULL> <NULL> <NA>
65 <NA> <NULL> TRT01A Xanomeline Low Dose tabulate N N 254 0 <NULL> <NULL> <NA>
66 <NA> <NULL> TRT01A Xanomeline Low Dose tabulate p % 0.3779528 <fn> <NULL> <NULL> <NA>
67 <NA> <NULL> TRTDUR <NULL> attributes label Variable Label Duration of Treatment, days <fn> <NULL> <NULL> <NA>
68 <NA> <NULL> TRTDUR <NULL> attributes class Variable Class logical <NULL> <NULL> <NULL> <NA>
69 <NA> <NULL> D_ANY <NULL> attributes label Variable Label >= 1 day <fn> <NULL> <NULL> <NA>
70 <NA> <NULL> D_ANY <NULL> attributes class Variable Class logical <NULL> <NULL> <NULL> <NA>
71 <NA> <NULL> D_GT1 <NULL> attributes label Variable Label >=1 month <fn> <NULL> <NULL> <NA>
72 <NA> <NULL> D_GT1 <NULL> attributes class Variable Class logical <NULL> <NULL> <NULL> <NA>
73 <NA> <NULL> D_GT3 <NULL> attributes label Variable Label >=3 months <fn> <NULL> <NULL> <NA>
74 <NA> <NULL> D_GT3 <NULL> attributes class Variable Class logical <NULL> <NULL> <NULL> <NA>
75 <NA> <NULL> D_GT6 <NULL> attributes label Variable Label >=6 months <fn> <NULL> <NULL> <NA>
76 <NA> <NULL> D_GT6 <NULL> attributes class Variable Class logical <NULL> <NULL> <NULL> <NA>
77 <NA> <NULL> D_GT12 <NULL> attributes label Variable Label >=12 months <fn> <NULL> <NULL> <NA>
78 <NA> <NULL> D_GT12 <NULL> attributes class Variable Class logical <NULL> <NULL> <NULL> <NA>