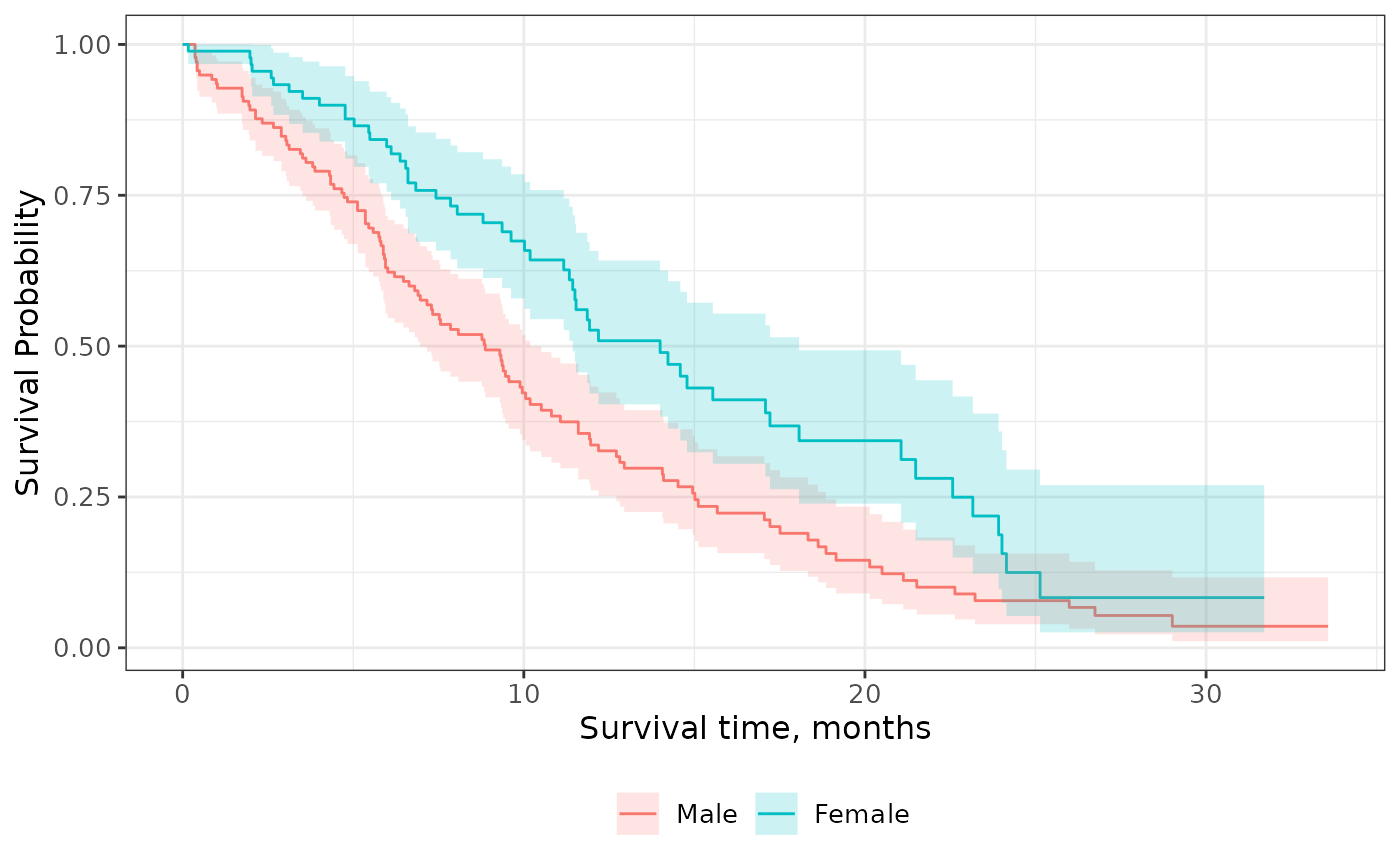
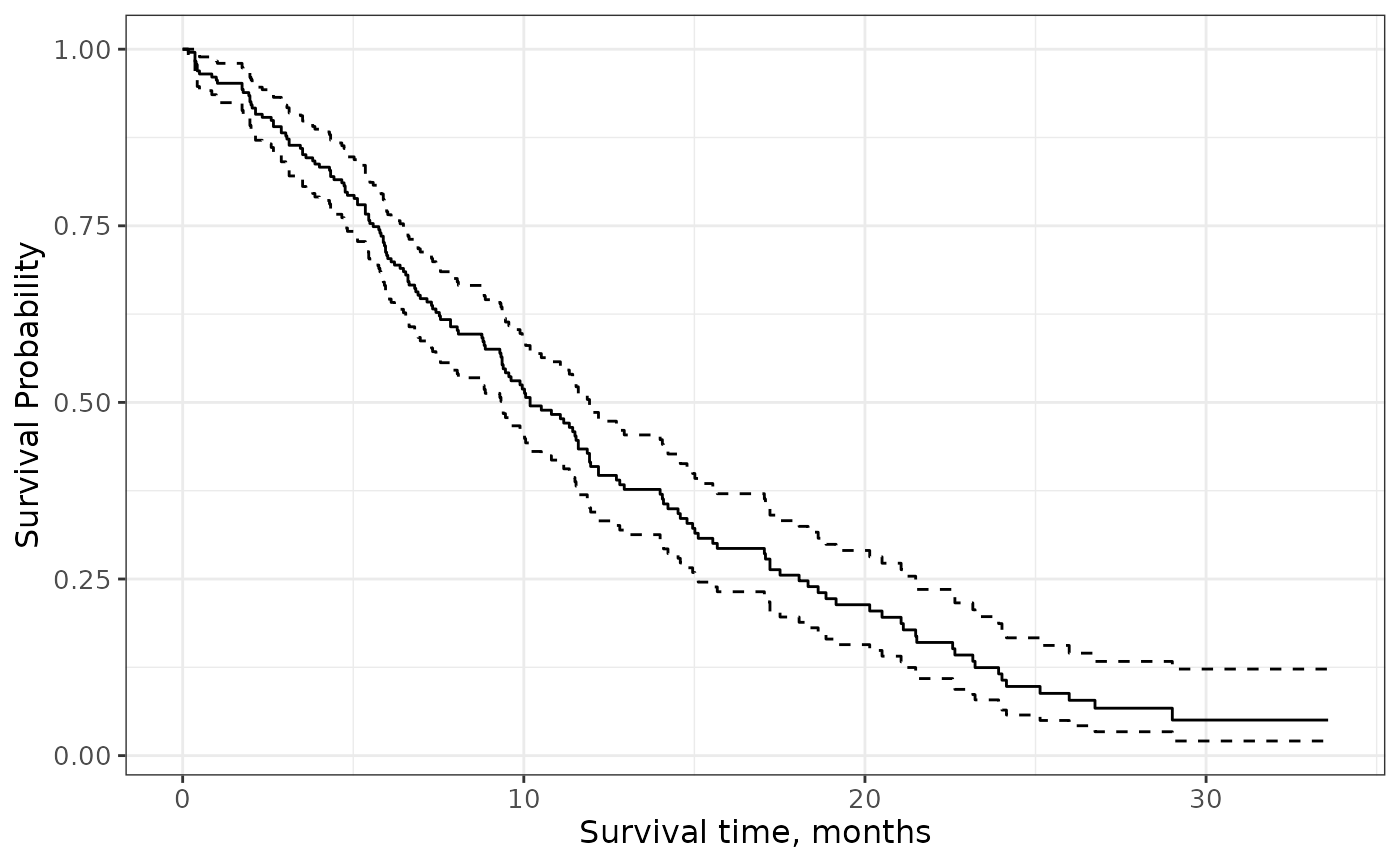
Add a confidence interval represented by either a ribbon or lines.
Usage
add_confidence_interval(type = c("ribbon", "lines"), ...)Arguments
- type
string indicating the type of confidence interval to draw. Must be one of
c("ribbon", "lines")- ...
arguments pass to geom.
type = 'ribbon': Defaults areggplot2::geom_ribbon(alpha = 0.2, color = NA, ...)type = 'lines': Defaults areggplot2::geom_step(linetype = "dashed", na.rm = TRUE, ...)
See also
Visit the gallery for examples modifying the default figures