This function creates a ggplot2 line plot for pharmacokinetic (PK) data. The function supports various customizations including log scales, faceting and threshold lines.
Usage
g_lineplot(
  data,
  x_var,
  y_var,
  x_unit = NULL,
  y_unit = NULL,
  color_by,
  color_labels = NULL,
  facet_by = NULL,
  group_by = NULL,
  facet_count_n = NULL,
  x_limits = NULL,
  y_limits = NULL,
  ylog_scale = FALSE,
  threshold_value = NULL,
  palette = "default",
  tooltip_vars = NULL,
  labels_df = NULL,
  vline_var = NULL,
  linetype_by = NULL,
  show_legend = TRUE
)
Arguments
- data
A data.frame containing the data to be plotted. This should be pre-processed by either
process_data_individualorprocess_data_mean.- x_var
A character string specifying the column name for the x-axis.
- y_var
A character string specifying the column name for the y-axis.
- x_unit
Optional character string specifying the column name for the x-axis unit.
- y_unit
Optional character string specifying the column name for the y-axis unit.
- color_by
A character vector specifying the column(s) from the original dataset that are used to determine the color of the lines and points.
- color_labels
Optional character vector of labels for the color legend. Default is
NULL(usescolor_byvalues).- facet_by
A character vector of column names to facet the plot by. Default is
NULLfor no faceting.- group_by
A character vector specifying the column names used to group the lines. Default is NULL for no grouping.
- facet_count_n
A character string specifying the column name used to count unique subjects per facet. Default is
NULL(no counts shown).- x_limits
Numeric vector of length 2 for x-axis limits (min, max). Default is
NULL(no limits).- y_limits
Numeric vector of length 2 for y-axis limits (min, max). Default is
NULL(no limits).- ylog_scale
A logical value (
TRUEorFALSE) indicating whether to use a logarithmic scale for the y-axis.- threshold_value
A numeric value for the y-intercept of the threshold line. Only used if
show_thresholdisTRUE.- palette
A character string specifying the color palette to use. Default is "default" palette.
- tooltip_vars
Character vector of column names to include in the tooltip.
- labels_df
A data.frame for variable label lookups.
- vline_var
Optional character string specifying the column name for vertical lines.
- linetype_by
Optional character vector specifying the column name for line types.
- show_legend
Logical; whether to display the plot legend. Default is
TRUE.
Examples
library(dplyr)
#>
#> Attaching package: ‘dplyr’
#> The following objects are masked from ‘package:stats’:
#>
#> filter, lag
#> The following objects are masked from ‘package:base’:
#>
#> intersect, setdiff, setequal, union
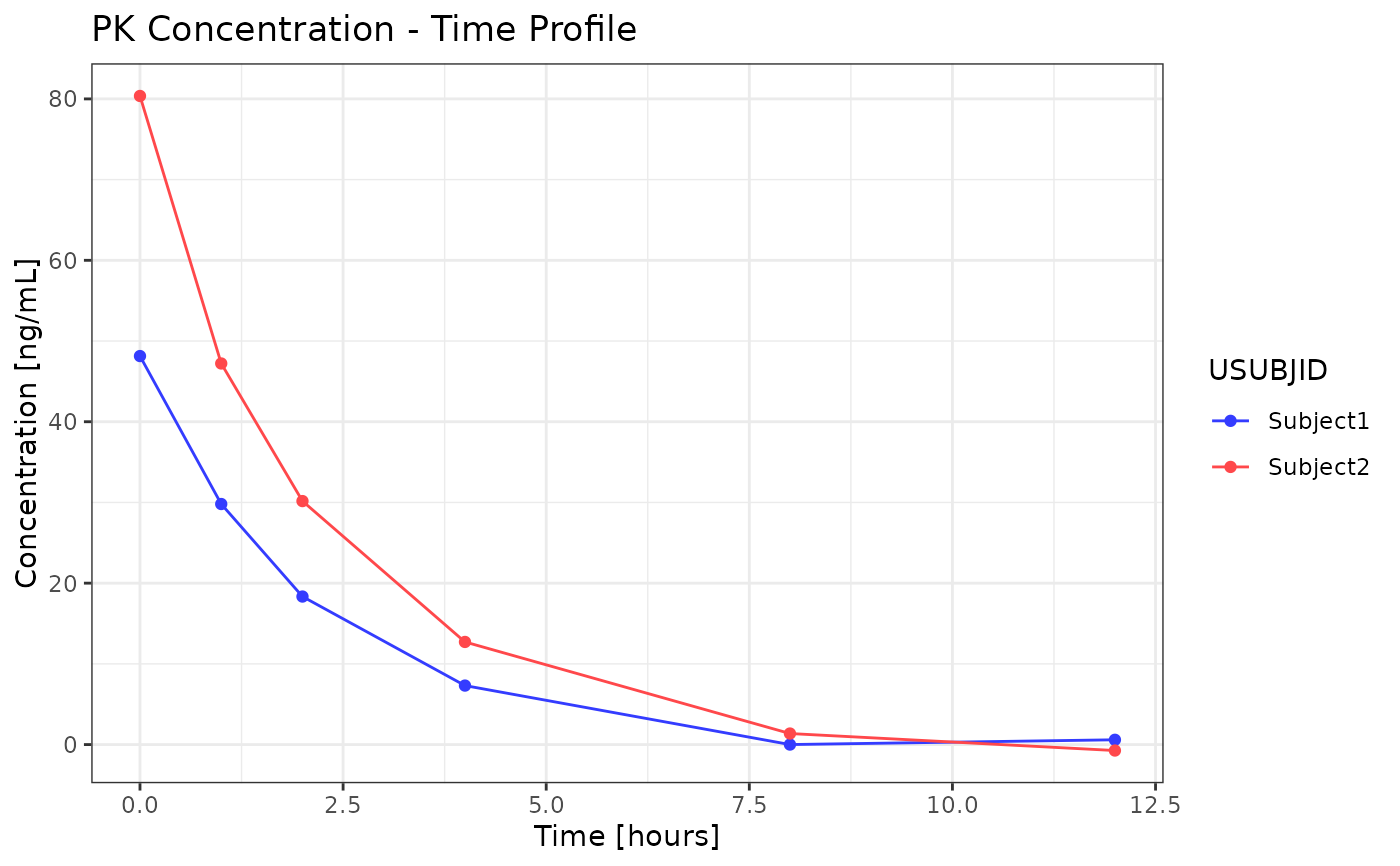
ind_data <- expand.grid(
time_var = c(0, 1, 2, 4, 8, 12),
USUBJID = c("Subject1", "Subject2")
) %>%
mutate(
AVAL = ifelse(USUBJID == "Subject1", 50, 80) * exp(-0.5 * time_var) + rnorm(n(), 0, 1),
PARAM = "Analyte1",
DOSEA = "Dose 1",
RRLTU = "hours",
AVALU = "ng/mL"
)
p <- g_lineplot(
data = ind_data,
x_var = "time_var",
y_var = "AVAL",
color_by = "USUBJID"
)
print(p)