Disclaimer: This blog contains opinions that are of the authors alone and do not necessarily reflect the strategy of their respective organizations.
The humble View() and its limits
View() has served R programmers well for a long time — pass it a data frame, get a spreadsheet-style window. It even has a basic search bar for checking whether a value exists in your data. But the moment you need something more precise — filter by a specific column or combine conditions — you are back in your script.
Add to that: no side-by-side dataset comparison, no metadata inspection, and no way to carry your exploration into reproducible code. For day-to-day clinical data work — reviewing your clinical datasets, let’s say ADSL, cross-checking subject demographics against lab data in ADLB, doing a QC pass before analysis — these gaps add up.
What is dataviewR?
dataviewR is a Shiny-based interactive data viewer that works alongside View() as a companion — not a replacement. It launches directly in your RStudio Viewer pane, requires no Shiny code, and never modifies the datasets passed to it.
install.packages("dataviewR")Features
dataviewR offers the following capabilities:
- Interactive Filtering — apply
dplyr-style expressions directly in the app, no script changes needed. Supports%in%,is.na(),grepl(), and compound conditions — the same syntax you already write every day.
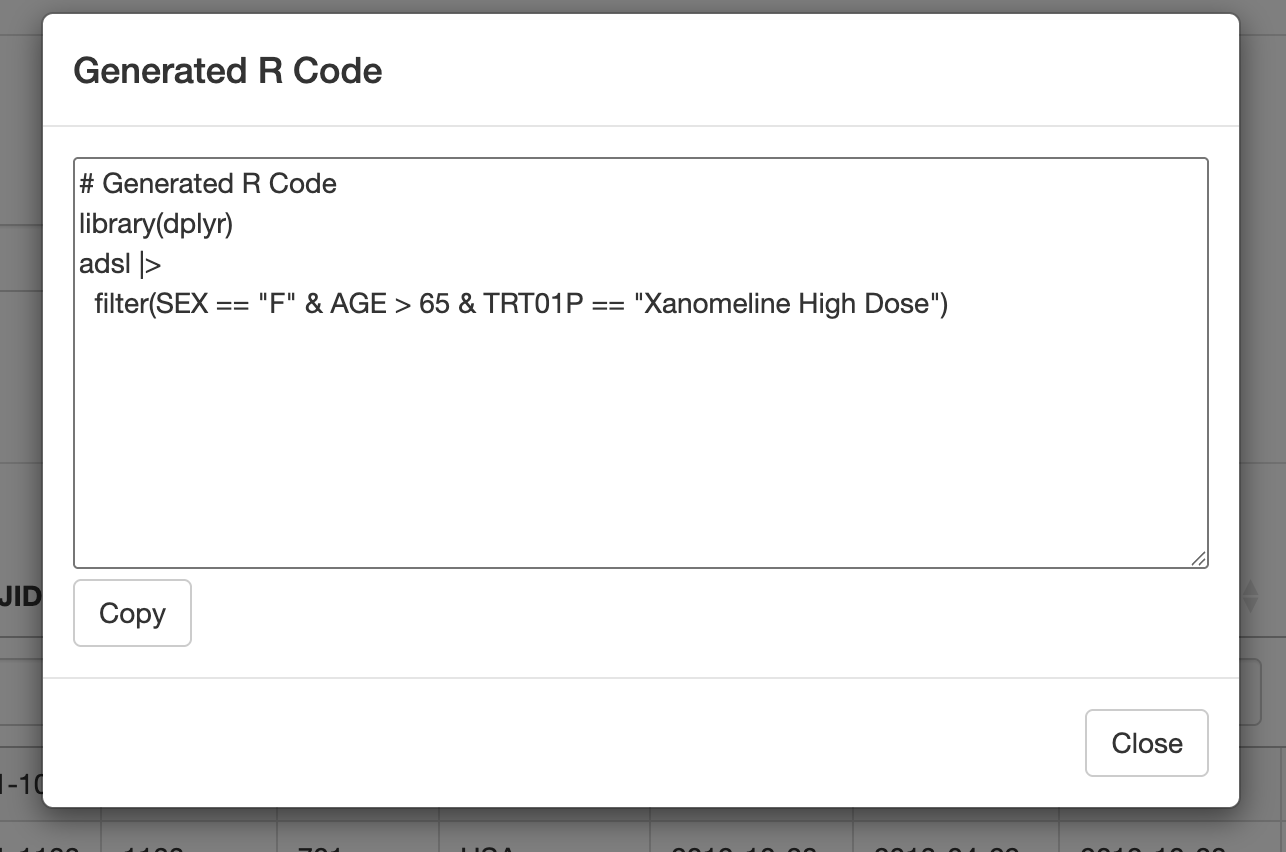
SEX == "F" & AGE > 65 & TRT01P == "Xanomeline High Dose"- Reproducible Code Generation — hit “Generate R Code” and walk away with ready-to-use
dplyrcode from your interactions. Your exploration session feeds directly into your scripted workflow.
- Variable Metadata — inspect variable classes, labels and attributes without writing
str()orattr()calls. Particularly useful for clinical datasets where CDISC-style labels are carried as R attributes.
See all of this in action:
Cross-Checking Multiple Datasets
But what if you need to look at more than one dataset at the same time? dataviewR handles that too — pass multiple datasets in a single call and each opens in its own tab within the same session. Switch between them, filter independently, and track a specific subject across datasets — the kind of check that comes up in every safety review.
library(dataviewR)
library(pharmaverseadam)

dataviewer(adsl, adlb)
Final Thoughts
That is dataviewR in a nutshell. Try it out and share your thoughts on GitHub or pharmaverse Slack!
Full documentation, vignettes, and clinical dataset examples are available at madhankumarnagaraji.github.io/dataviewR.
Last updated
2026-07-21 13:51:35.424845
Details
Reuse
Citation
BibTeX citation:
@online{pujari2026,
  author = {Pujari, Siddhesh and Kumar N, Madhan and S, Gomathi and
    Haight, Mackenzie},
  title = {Meet {dataviewR:} {The} {View()} {You} {Always} {Wanted}},
  date = {2026-03-31},
  url = {https://pharmaverse.github.io/blog/posts/2026-03-29-meet-dataviewr-the/meet-dataviewr-the-view-you-always-wanted.html},
  langid = {en}
}
For attribution, please cite this work as:
Pujari, Siddhesh, Madhan Kumar N, Gomathi S, and Mackenzie Haight. 2026.
“Meet dataviewR: The View() You Always Wanted.” March 31,
2026. https://pharmaverse.github.io/blog/posts/2026-03-29-meet-dataviewr-the/meet-dataviewr-the-view-you-always-wanted.html.