This function creates a complex layout for a gridify object. The layout consists of six rows and three columns for headers, titles, notes and footnotes around the output.
Arguments
- margin
A unit object specifying the margins around the output. Default is 10% of the output area on all sides.
- global_gpar
A gpar object specifying the global graphical parameters. Must be the result of a call to
grid::gpar().- background
A string specifying the background fill colour. Default
grid::get.gpar()$fillfor a white background.- scales
A string, either
"free"or"fixed". By default,"fixed"ensures that text elements (titles, footers, etc.) retain a static height, preventing text overlap while maintaining a structured layout. However, this may result in different height proportions between the text elements and the output.The
"free"option makes the row heights proportional, allowing them to scale dynamically based on the overall output size. This ensures that the text elements and the output maintain relative proportions.- object_vjust
A numeric value in
[0, 1]controlling the vertical anchoring of the object within its row.0aligns to the bottom,0.5(default) centers it, and1aligns to the top. Useful when the object's row is taller than the object itself. Has no effect on flexible grobs (e.g.ggplot2::ggplotGrob()), which always fill the full row. For fixed-size table grobs such asgtandflextable, values at the edge (0or1) place the table directly against the object-row edge. Use an inset value such as0.05or0.95if nearby text appears too close.
Details
The layout consists of six rows for headers, titles, object (figure or table), notes, and footnotes.
The object is placed in the fourth row.
With
"free"scales, the row heights are 5%, 5%, 5%, 70%, 5%, and 10% of the area, respectively.With
"fixed"scales, the row heights are adjusted by the number of lines for all text elements around the object, with the remaining area occupied by the object. Note that reducing the output space will retain the space for all text elements, making the object appear smaller.
Note
The Font Issue Information:
Changes to the fontfamily may be ignored by some devices, but is supported by PostScript, PDF, X11, Windows, and Quartz. The fontfamily may be used to specify one of the Hershey Font families (e.g., HersheySerif, serif), and this specification will be honoured on all devices.
If you encounter this warning, you can register the fonts using the extrafont package:
If you still see the warning while using RStudio, try changing the graphics backend.
Negative Dimensions Issues:
grobs from the grid package and ggplot2 objects (when converted to grobs by gridify) may appear distorted in the output if there is insufficient space in the window, caused by negative dimensions. This should be resolved. However, if this is affecting your layout, please increase your window size or only use static heights/widths for custom layouts.
The negative dimensions are caused by the way grid handles null and npc heights/widths so if some dimensions are
static, then the npc or null values may cause unexpected behaviour when the window size is too small.
It was resolved by setting a minimum size of the object in the gridify object to 1 inch for each dimension.
The following example demonstrates this behaviour Try resizing your window:
library(grid)
library(ggplot2)
grid.newpage()
object <- ggplot2::ggplotGrob(ggplot(mtcars, aes(mpg, wt)) + geom_line())
grid::grid.draw(
  grid::grobTree(
    grid::grobTree(
      grid::editGrob(
        object,
        vp = grid::viewport(
          # height = grid::unit.pmax(grid::unit(1, "npc"), grid::unit(1, "inch")),
          # width = grid::unit.pmax(grid::unit(1, "npc"), grid::unit(1, "inch"))
        )
      ),
      vp = grid::viewport(
        layout.pos.row = 2,
        layout.pos.col = 1:3
      )
    ),
    vp = grid::viewport(
      layout = grid::grid.layout(
        nrow = 3,
        ncol = 3,
        heights = grid::unit(c(9, 1, 9), c("cm", "null", "cm"))
      )
    )
  )
)
gt Font Size Issue:
When specifying font sizes, the gt package interprets values as having the
unit pixels (px), whilst the grid package, on which gridify is built,
assumes points (pt). As a result, even if you set the font sizes in both
gt and gridify (using grid::gpar()) to the same number, they may
still appear different. To convert point size to pixel size, multiply the point size by 96 / 72.
Examples
complex_layout()
#> gridifyLayout object
#> ---------------------
#> Layout dimensions:
#> Number of rows: 6
#> Number of columns: 3
#>
#> Heights of rows:
#> Row 1: 0 lines
#> Row 2: 0 lines
#> Row 3: 0 lines
#> Row 4: 1 null
#> Row 5: 0 lines
#> Row 6: 0 lines
#>
#> Widths of columns:
#> Column 1: 0.333333333333333 npc
#> Column 2: 0.333333333333333 npc
#> Column 3: 0.333333333333333 npc
#>
#> Object Position:
#> Row: 4
#> Col: 1-3
#> Width: 1
#> Height: 1
#> Vjust: 0.5
#>
#> Object Row Heights:
#> Row 4: 1 null
#>
#> Margin:
#> Top: 0.1 npc
#> Right: 0.1 npc
#> Bottom: 0.1 npc
#> Left: 0.1 npc
#>
#> Global graphical parameters:
#> Are not set
#>
#> Background colour:
#> white
#>
#> Default Cell Info:
#> header_left:
#> row:1, col:1, text:NULL, mch:Inf, x:0.5, y:0.5, hjust:0.5, vjust:0.5, rot:0,
#> header_middle:
#> row:1, col:2, text:NULL, mch:Inf, x:0.5, y:0.5, hjust:0.5, vjust:0.5, rot:0,
#> header_right:
#> row:1, col:3, text:NULL, mch:Inf, x:0.5, y:0.5, hjust:0.5, vjust:0.5, rot:0,
#> title:
#> row:2, col:1-3, text:NULL, mch:Inf, x:0.5, y:0.5, hjust:0.5, vjust:0.5, rot:0,
#> subtitle:
#> row:3, col:1-3, text:NULL, mch:Inf, x:0.5, y:0.5, hjust:0.5, vjust:0.5, rot:0,
#> note:
#> row:5, col:1-3, text:NULL, mch:Inf, x:0.5, y:0.5, hjust:0.5, vjust:0.5, rot:0,
#> footer_left:
#> row:6, col:1, text:NULL, mch:Inf, x:0.5, y:0.5, hjust:0.5, vjust:0.5, rot:0,
#> footer_middle:
#> row:6, col:2, text:NULL, mch:Inf, x:0.5, y:0.5, hjust:0.5, vjust:0.5, rot:0,
#> footer_right:
#> row:6, col:3, text:NULL, mch:Inf, x:0.5, y:0.5, hjust:0.5, vjust:0.5, rot:0,
#>
# (to use |> version 4.1.0 of R is required, for lower versions we recommend %>% from magrittr)
library(magrittr)
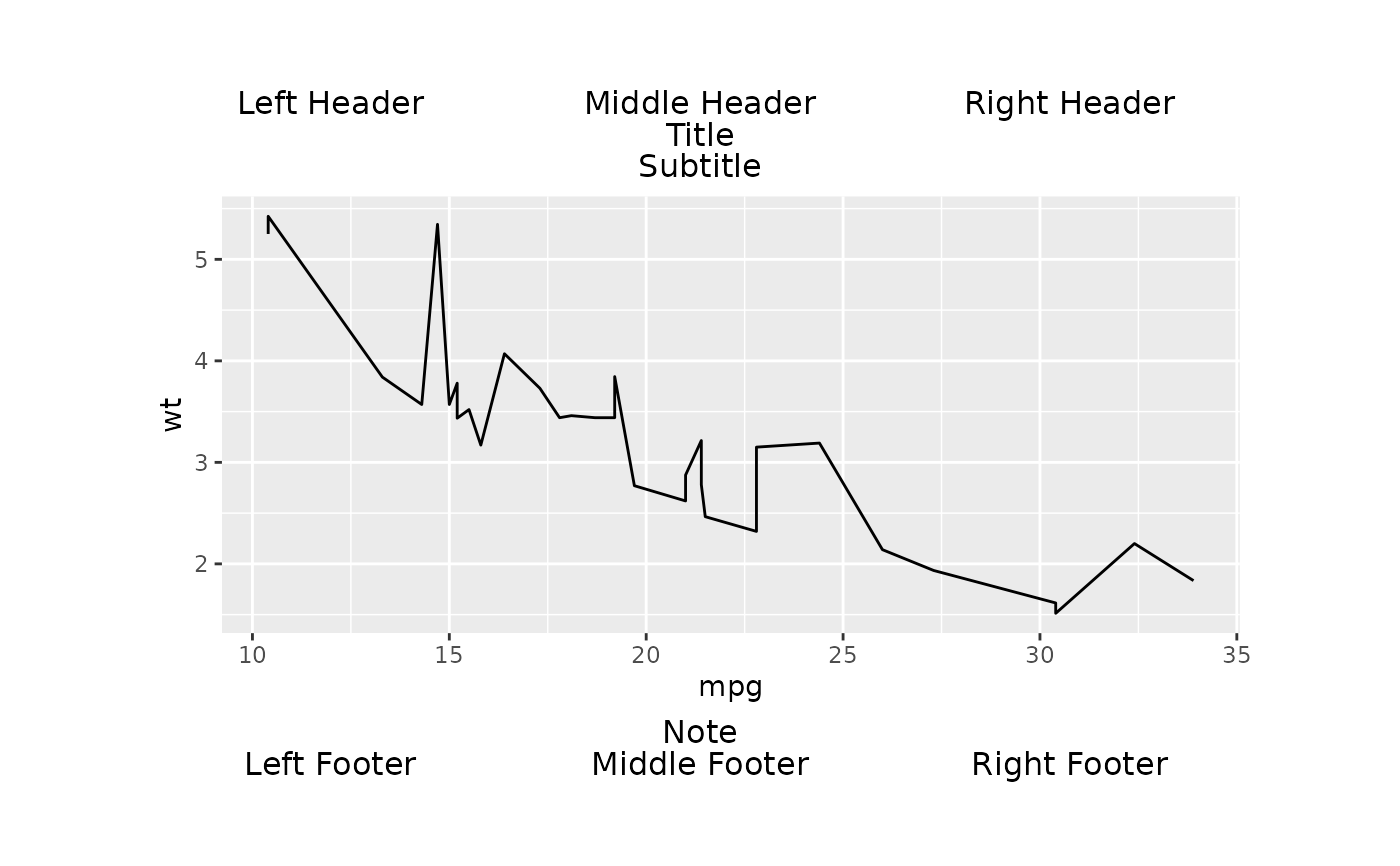
gridify(
object = ggplot2::ggplot(data = mtcars, ggplot2::aes(x = mpg, y = wt)) +
ggplot2::geom_line(),
layout = complex_layout()
) %>%
set_cell("header_left", "Left Header") %>%
set_cell("header_middle", "Middle Header") %>%
set_cell("header_right", "Right Header") %>%
set_cell("title", "Title") %>%
set_cell("subtitle", "Subtitle") %>%
set_cell("note", "Note") %>%
set_cell("footer_left", "Left Footer") %>%
set_cell("footer_middle", "Middle Footer") %>%
set_cell("footer_right", "Right Footer")
#> gridifyClass object
#> ---------------------
#> Please run `show_spec(object)` or print the layout to get more specs.
#>
#> Cells:
#> header_left: filled
#> header_middle: filled
#> header_right: filled
#> title: filled
#> subtitle: filled
#> note: filled
#> footer_left: filled
#> footer_middle: filled
#> footer_right: filled
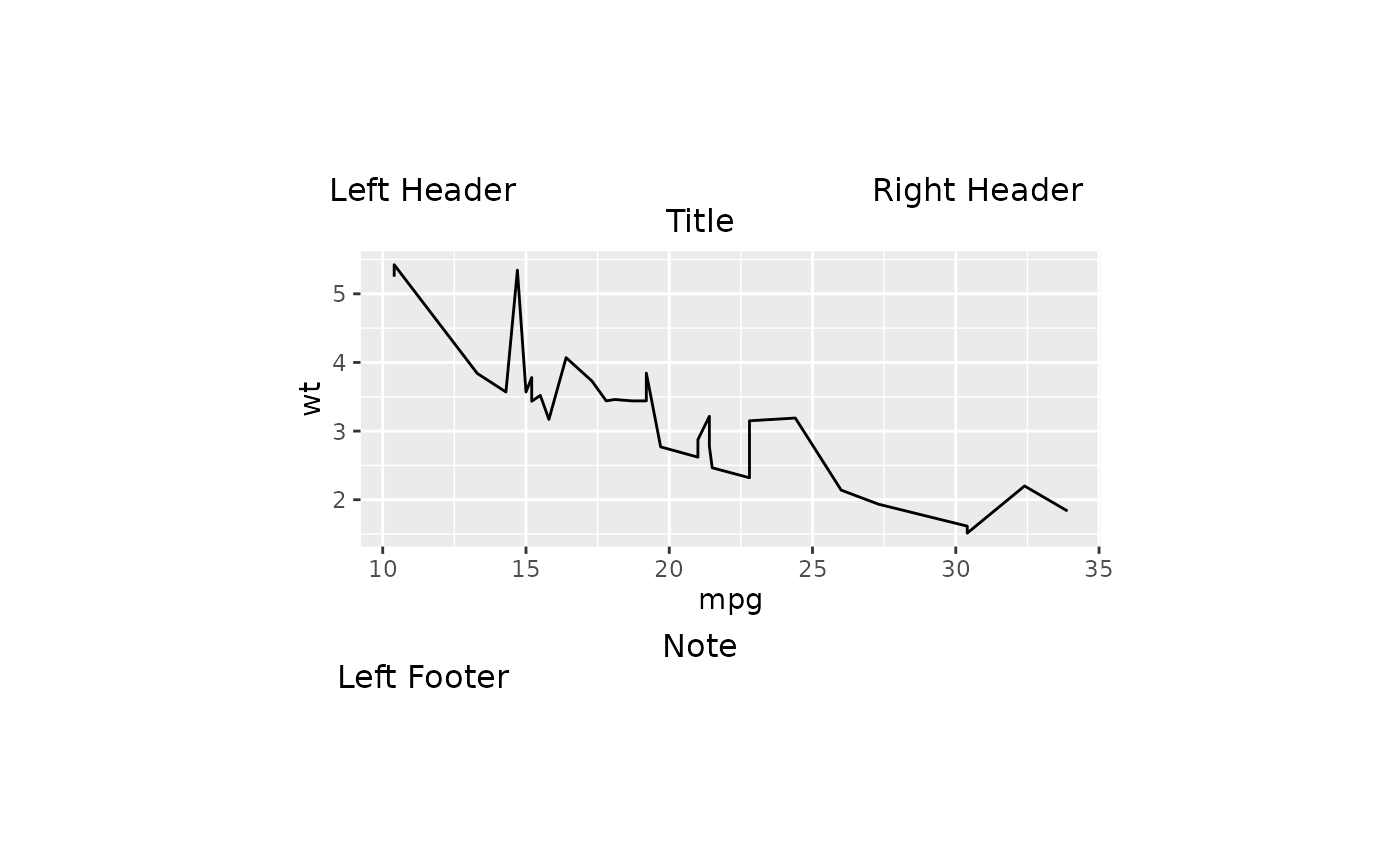
 gridify(
object = ggplot2::ggplot(data = mtcars, ggplot2::aes(x = mpg, y = wt)) +
ggplot2::geom_line(),
layout = complex_layout(margin = grid::unit(c(t = 0.2, r = 0.2, b = 0.2, l = 0.2), units = "npc"))
) %>%
set_cell("header_left", "Left Header") %>%
set_cell("header_right", "Right Header") %>%
set_cell("title", "Title") %>%
set_cell("note", "Note") %>%
set_cell("footer_left", "Left Footer")
#> gridifyClass object
#> ---------------------
#> Please run `show_spec(object)` or print the layout to get more specs.
#>
#> Cells:
#> header_left: filled
#> header_middle: empty
#> header_right: filled
#> title: filled
#> subtitle: empty
#> note: filled
#> footer_left: filled
#> footer_middle: empty
#> footer_right: empty
gridify(
object = ggplot2::ggplot(data = mtcars, ggplot2::aes(x = mpg, y = wt)) +
ggplot2::geom_line(),
layout = complex_layout(margin = grid::unit(c(t = 0.2, r = 0.2, b = 0.2, l = 0.2), units = "npc"))
) %>%
set_cell("header_left", "Left Header") %>%
set_cell("header_right", "Right Header") %>%
set_cell("title", "Title") %>%
set_cell("note", "Note") %>%
set_cell("footer_left", "Left Footer")
#> gridifyClass object
#> ---------------------
#> Please run `show_spec(object)` or print the layout to get more specs.
#>
#> Cells:
#> header_left: filled
#> header_middle: empty
#> header_right: filled
#> title: filled
#> subtitle: empty
#> note: filled
#> footer_left: filled
#> footer_middle: empty
#> footer_right: empty
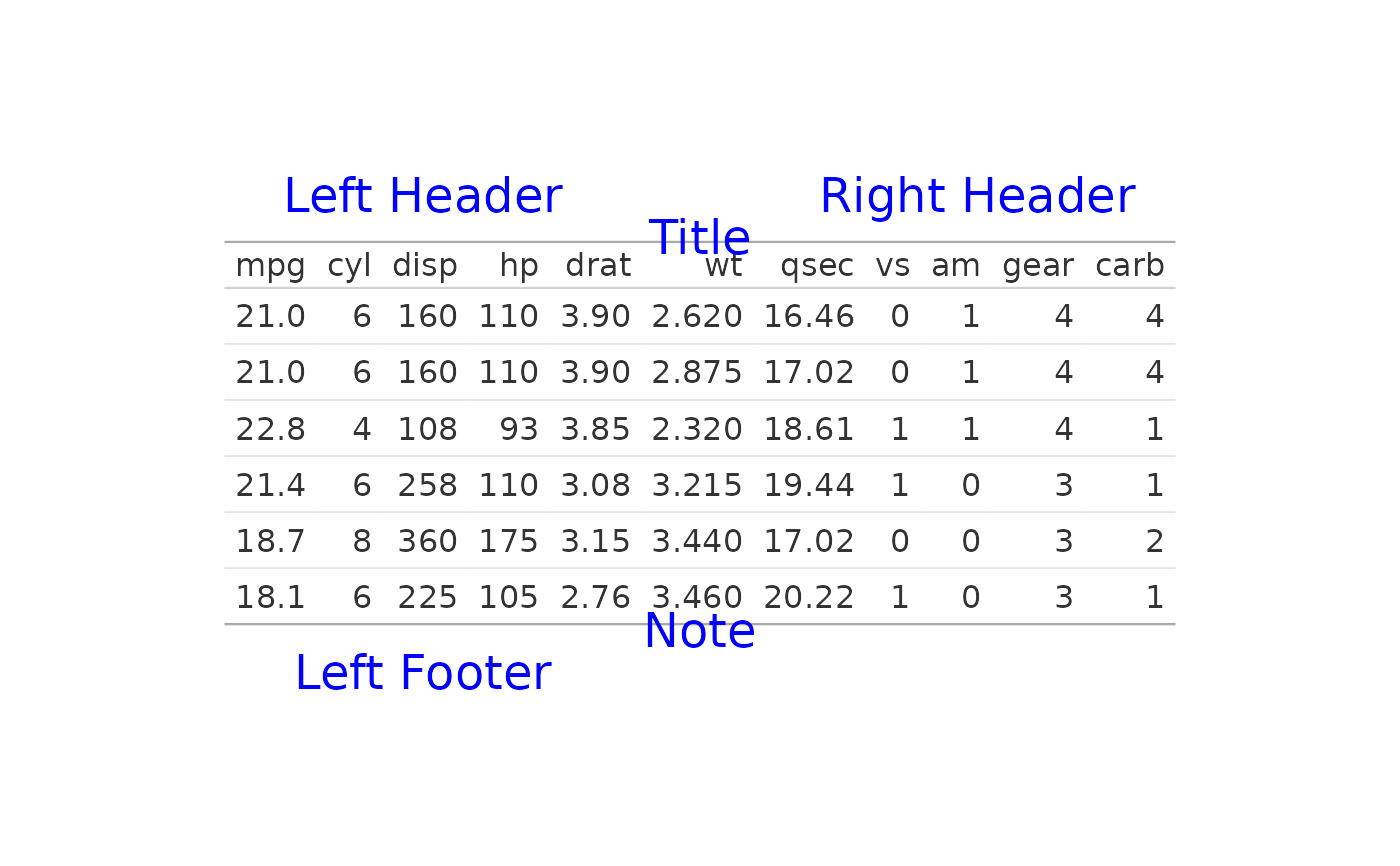
 gridify(
object = gt::gt(head(mtcars)),
layout = complex_layout(
margin = grid::unit(c(t = 0.2, r = 0.2, b = 0.2, l = 0.2), units = "npc"),
global_gpar = grid::gpar(col = "blue", fontsize = 18)
)
) %>%
set_cell("header_left", "Left Header") %>%
set_cell("header_right", "Right Header") %>%
set_cell("title", "Title") %>%
set_cell("note", "Note") %>%
set_cell("footer_left", "Left Footer")
#> gridifyClass object
#> ---------------------
#> Please run `show_spec(object)` or print the layout to get more specs.
#>
#> Cells:
#> header_left: filled
#> header_middle: empty
#> header_right: filled
#> title: filled
#> subtitle: empty
#> note: filled
#> footer_left: filled
#> footer_middle: empty
#> footer_right: empty
gridify(
object = gt::gt(head(mtcars)),
layout = complex_layout(
margin = grid::unit(c(t = 0.2, r = 0.2, b = 0.2, l = 0.2), units = "npc"),
global_gpar = grid::gpar(col = "blue", fontsize = 18)
)
) %>%
set_cell("header_left", "Left Header") %>%
set_cell("header_right", "Right Header") %>%
set_cell("title", "Title") %>%
set_cell("note", "Note") %>%
set_cell("footer_left", "Left Footer")
#> gridifyClass object
#> ---------------------
#> Please run `show_spec(object)` or print the layout to get more specs.
#>
#> Cells:
#> header_left: filled
#> header_middle: empty
#> header_right: filled
#> title: filled
#> subtitle: empty
#> note: filled
#> footer_left: filled
#> footer_middle: empty
#> footer_right: empty