This function sets up the general structure for positioning the text elements for pharma layouts using the A4 paper size.
Usage
pharma_layout_A4(
  global_gpar = NULL,
  background = grid::get.gpar()$fill,
  object_vjust = 0.5
)
Arguments
- global_gpar
A list specifying global graphical parameters to change in the layout. Default is NULL, however the defaults in the layout, inherited from
pharma_layout_base(), are:fontfamily = "Serif", fontsize = 9 and lineheight = 0.95, which can be overwritten alongside other graphical parameters found bygrid::get.gpar().- background
A character string specifying the background fill colour. Default
grid::get.gpar()$fillfor a white background.- object_vjust
A numeric value in
[0, 1]controlling the vertical anchoring of the object within its row.0aligns to the bottom,0.5(default) centers it, and1aligns to the top. Useful when the object's row is taller than the object itself. Has no effect on flexible grobs (e.g.ggplot2::ggplotGrob()), which always fill the full row. For fixed-size table grobs such asgtandflextable, values at the edge (0or1) place the table directly against the object-row edge. Use an inset value such as0.05or0.95if nearby text appears too close.
Details
The margins for the A4 layout are:
top = 1 inch
right = 1.69 inches
bottom = 1 inch
left = 1 inch
The pharma_layout_base() function is used to set up the general layout structure,
with these specific margins applied for the A4 format.
Note
The Font Issue Information:
Changes to the fontfamily may be ignored by some devices, but is supported by PostScript, PDF, X11, Windows, and Quartz. The fontfamily may be used to specify one of the Hershey Font families (e.g., HersheySerif, serif), and this specification will be honoured on all devices.
If you encounter this warning, you can register the fonts using the extrafont package:
If you still see the warning while using RStudio, try changing the graphics backend.
Negative Dimensions Issues:
grobs from the grid package and ggplot2 objects (when converted to grobs by gridify) may appear distorted in the output if there is insufficient space in the window, caused by negative dimensions. This should be resolved. However, if this is affecting your layout, please increase your window size or only use static heights/widths for custom layouts.
The negative dimensions are caused by the way grid handles null and npc heights/widths so if some dimensions are
static, then the npc or null values may cause unexpected behaviour when the window size is too small.
It was resolved by setting a minimum size of the object in the gridify object to 1 inch for each dimension.
The following example demonstrates this behaviour Try resizing your window:
library(grid)
library(ggplot2)
grid.newpage()
object <- ggplot2::ggplotGrob(ggplot(mtcars, aes(mpg, wt)) + geom_line())
grid::grid.draw(
  grid::grobTree(
    grid::grobTree(
      grid::editGrob(
        object,
        vp = grid::viewport(
          # height = grid::unit.pmax(grid::unit(1, "npc"), grid::unit(1, "inch")),
          # width = grid::unit.pmax(grid::unit(1, "npc"), grid::unit(1, "inch"))
        )
      ),
      vp = grid::viewport(
        layout.pos.row = 2,
        layout.pos.col = 1:3
      )
    ),
    vp = grid::viewport(
      layout = grid::grid.layout(
        nrow = 3,
        ncol = 3,
        heights = grid::unit(c(9, 1, 9), c("cm", "null", "cm"))
      )
    )
  )
)
gt Font Size Issue:
When specifying font sizes, the gt package interprets values as having the
unit pixels (px), whilst the grid package, on which gridify is built,
assumes points (pt). As a result, even if you set the font sizes in both
gt and gridify (using grid::gpar()) to the same number, they may
still appear different. To convert point size to pixel size, multiply the point size by 96 / 72.
Examples
pharma_layout_A4()
#> gridifyLayout object
#> ---------------------
#> Layout dimensions:
#> Number of rows: 14
#> Number of columns: 3
#>
#> Heights of rows:
#> Row 1: 1 lines
#> Row 2: 1 lines
#> Row 3: 1 lines
#> Row 4: 1 lines
#> Row 5: 1 lines
#> Row 6: 1 lines
#> Row 7: 0 lines
#> Row 8: 0 lines
#> Row 9: 1 lines
#> Row 10: 1 null
#> Row 11: 1 lines
#> Row 12: 1 lines
#> Row 13: 0 lines
#> Row 14: 1 lines
#>
#> Widths of columns:
#> Column 1: 0.333333333333333 npc
#> Column 2: 0.333333333333333 npc
#> Column 3: 0.333333333333333 npc
#>
#> Object Position:
#> Row: 10
#> Col: 1-3
#> Width: 1
#> Height: 1
#> Vjust: 0.5
#>
#> Object Row Heights:
#> Row 10: 1 null
#>
#> Margin:
#> Top: 1 inches
#> Right: 1.69 inches
#> Bottom: 1 inches
#> Left: 1 inches
#>
#> Global graphical parameters:
#> fill: white
#> col: black
#> lty: solid
#> lwd: 1
#> cex: 1
#> fontsize: 9
#> lineheight: 0.95
#> font: 1
#> fontfamily: serif
#> alpha: 1
#> lineend: round
#> linejoin: round
#> linemitre: 10
#> lex: 1
#>
#> Background colour:
#> white
#>
#> Default Cell Info:
#> header_left_1:
#> row:1, col:1, text:NULL, mch:Inf, x:0, y:0.5, hjust:0, vjust:0.5, rot:0,
#> header_left_2:
#> row:2, col:1, text:NULL, mch:Inf, x:0, y:0.5, hjust:0, vjust:0.5, rot:0,
#> header_left_3:
#> row:3, col:1, text:NULL, mch:Inf, x:0, y:0.5, hjust:0, vjust:0.5, rot:0,
#> header_right_1:
#> row:1, col:3, text:CONFIDENTI..., mch:Inf, x:1, y:0.5, hjust:1, vjust:0.5, rot:0,
#> header_right_2:
#> row:2, col:3, text:NULL, mch:Inf, x:1, y:0.5, hjust:1, vjust:0.5, rot:0,
#> header_right_3:
#> row:3, col:3, text:NULL, mch:Inf, x:1, y:0.5, hjust:1, vjust:0.5, rot:0,
#> output_num:
#> row:4, col:2, text:NULL, mch:Inf, x:0.5, y:0.5, hjust:0.5, vjust:0.5, rot:0,
#> title_1:
#> row:5, col:2, text:NULL, mch:Inf, x:0.5, y:0.5, hjust:0.5, vjust:0.5, rot:0,
#> title_2:
#> row:6, col:2, text:NULL, mch:Inf, x:0.5, y:0.5, hjust:0.5, vjust:0.5, rot:0,
#> title_3:
#> row:7, col:2, text:NULL, mch:Inf, x:0.5, y:0.5, hjust:0.5, vjust:0.5, rot:0,
#> by_line:
#> row:8-9, col:1-3, text:NULL, mch:Inf, x:0, y:0.5, hjust:0, vjust:0.5, rot:0,
#> note:
#> row:11, col:1-3, text:NULL, mch:100, x:0, y:0.5, hjust:0, vjust:0.5, rot:0,
#> references:
#> row:13, col:1, text:NULL, mch:Inf, x:0, y:0.5, hjust:0, vjust:0.5, rot:0,
#> footer_left:
#> row:14, col:1, text:NULL, mch:Inf, x:0, y:0.5, hjust:0, vjust:0.5, rot:0,
#> footer_right:
#> row:14, col:3, text:NULL, mch:Inf, x:1, y:0.5, hjust:1, vjust:0.5, rot:0,
#> watermark:
#> row:10, col:2, text:NULL, mch:Inf, x:0.5, y:0.5, hjust:0.5, vjust:0.5, rot:45,
#> gpar - fontsize:80, alpha:0.3,
#>
# (to use |> version 4.1.0 of R is required, for lower versions we recommend %>% from magrittr)
library(magrittr)
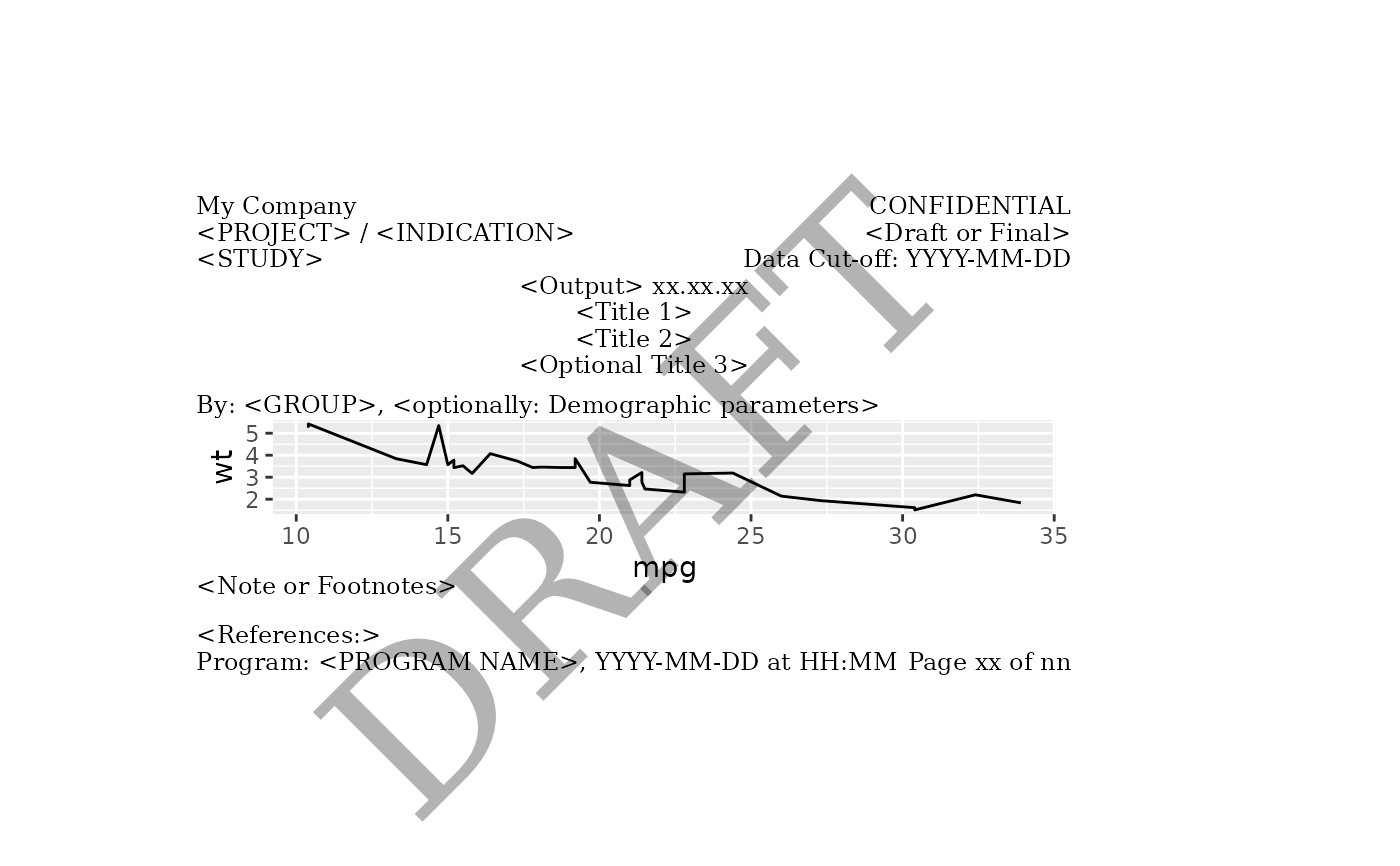
# Example with all cells filled out
gridify(
object = ggplot2::ggplot(data = mtcars, ggplot2::aes(x = mpg, y = wt)) +
ggplot2::geom_line(),
layout = pharma_layout_A4()
) %>%
set_cell("header_left_1", "My Company") %>%
set_cell("header_left_2", "<PROJECT> / <INDICATION>") %>%
set_cell("header_left_3", "<STUDY>") %>%
set_cell("header_right_1", "CONFIDENTIAL") %>%
set_cell("header_right_2", "<Draft or Final>") %>%
set_cell("header_right_3", "Data Cut-off: YYYY-MM-DD") %>%
set_cell("output_num", "<Output> xx.xx.xx") %>%
set_cell("title_1", "<Title 1>") %>%
set_cell("title_2", "<Title 2>") %>%
set_cell("title_3", "<Optional Title 3>") %>%
set_cell("by_line", "By: <GROUP>, <optionally: Demographic parameters>") %>%
set_cell("note", "<Note or Footnotes>") %>%
set_cell("references", "<References:>") %>%
set_cell("footer_left", "Program: <PROGRAM NAME>, YYYY-MM-DD at HH:MM") %>%
set_cell("footer_right", "Page xx of nn") %>%
set_cell("watermark", "DRAFT")
#> gridifyClass object
#> ---------------------
#> Please run `show_spec(object)` or print the layout to get more specs.
#>
#> Cells:
#> header_left_1: filled
#> header_left_2: filled
#> header_left_3: filled
#> header_right_1: filled
#> header_right_2: filled
#> header_right_3: filled
#> output_num: filled
#> title_1: filled
#> title_2: filled
#> title_3: filled
#> by_line: filled
#> note: filled
#> references: filled
#> footer_left: filled
#> footer_right: filled
#> watermark: filled