Method for showing the layout of a gridifyClass or gridifyLayout object. It prints the layout of the object, including the number of rows and columns and the heights and widths of the rows and columns in the graphics device.
Usage
show_layout(x)

# S4 method for class 'gridifyClass'
show_layout(x)

# S4 method for class 'gridifyLayout'
show_layout(x)Note
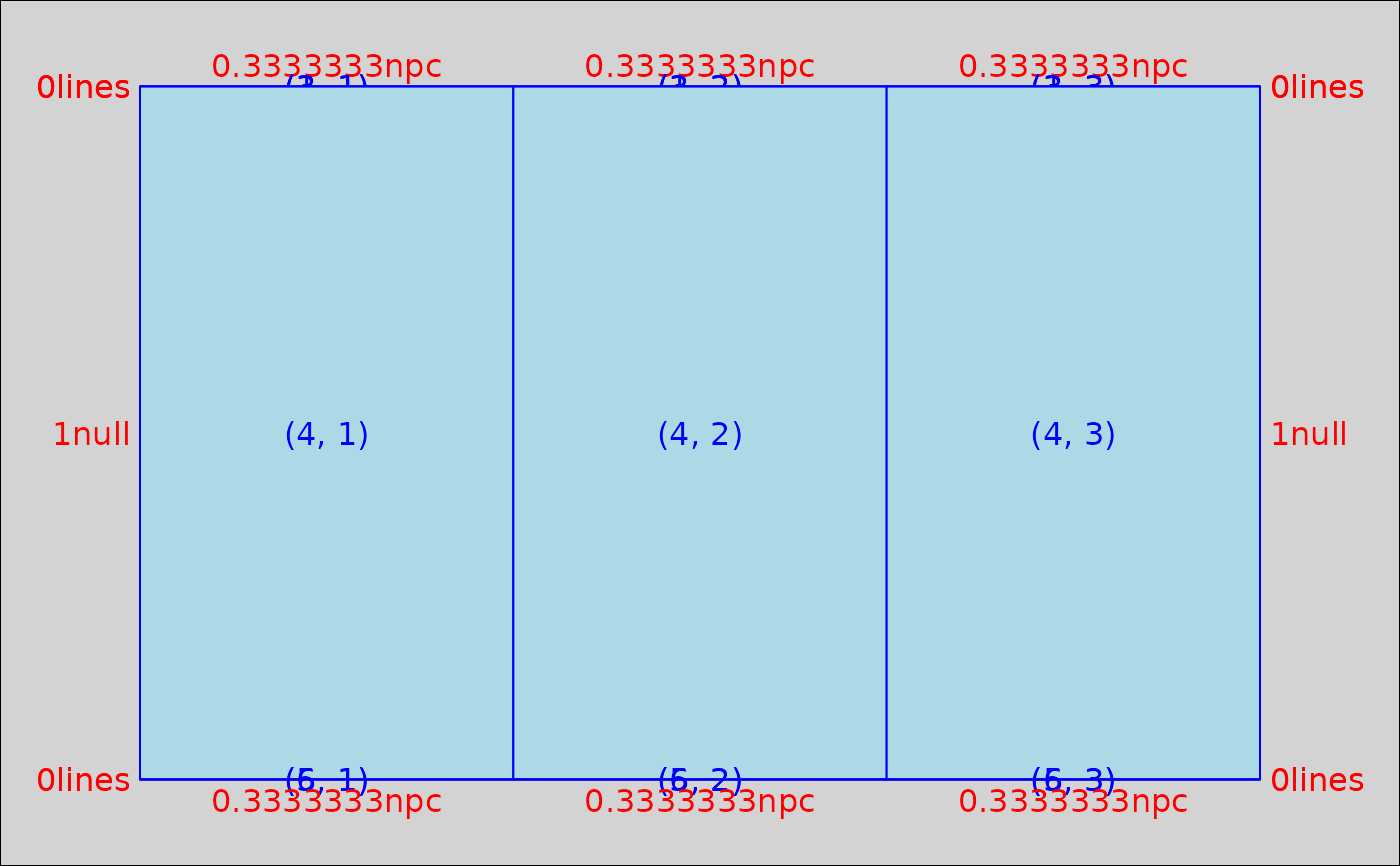
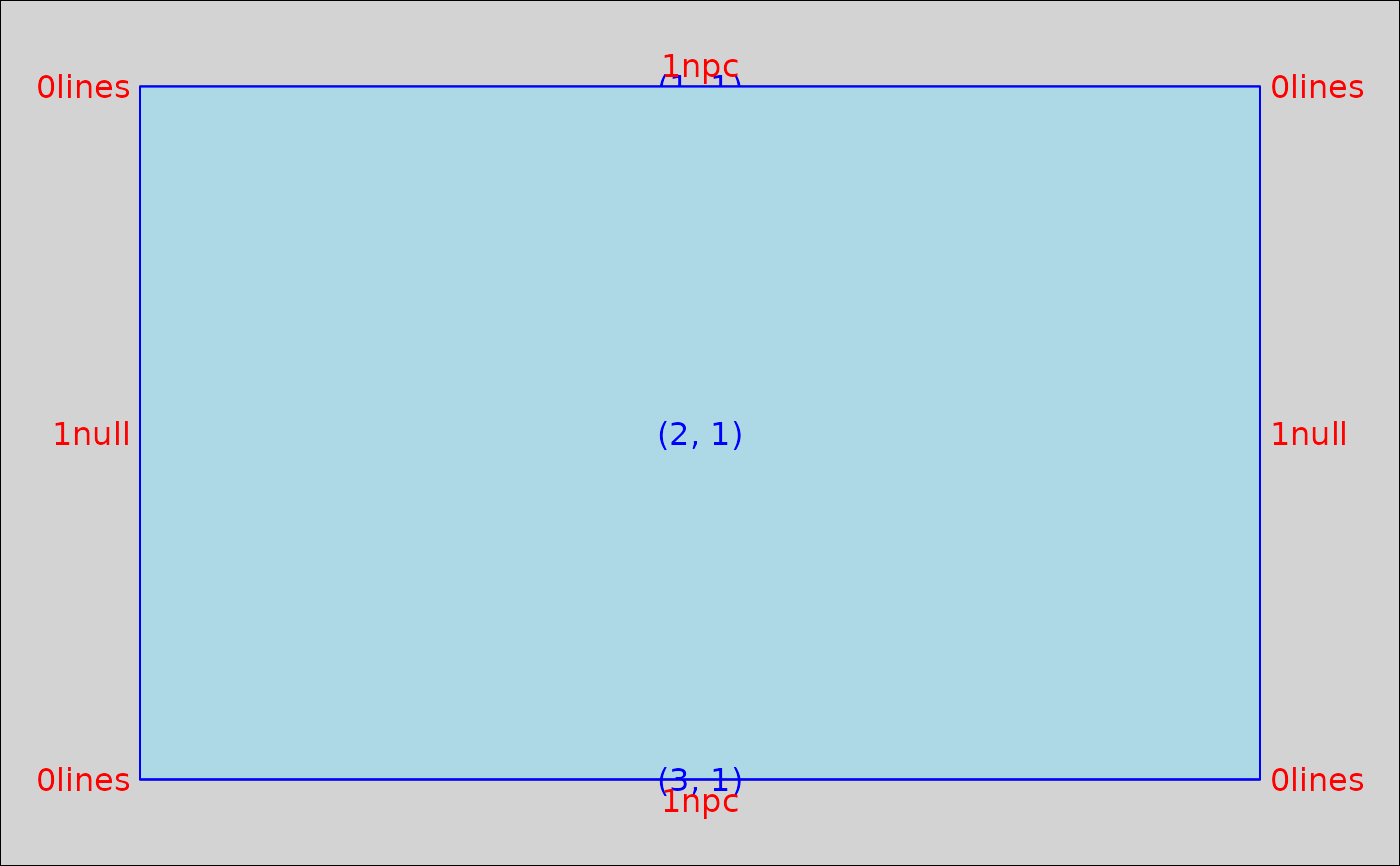
When using show_layout(), not all lines are initially visible. Some lines may be assigned zero space and are
dynamically updated to have more space once the text is added.
Examples
g <- gridify(
object = ggplot2::ggplot(data = mtcars, ggplot2::aes(x = mpg, y = wt)) +
ggplot2::geom_line(),
layout = simple_layout()
)
show_layout(g)
 g <- gridify(
object = ggplot2::ggplot(data = mtcars, ggplot2::aes(x = mpg, y = wt)) +
ggplot2::geom_line(),
layout = complex_layout()
)
show_layout(g)
g <- gridify(
object = ggplot2::ggplot(data = mtcars, ggplot2::aes(x = mpg, y = wt)) +
ggplot2::geom_line(),
layout = complex_layout()
)
show_layout(g)
 show_layout(simple_layout())
 show_layout(complex_layout())
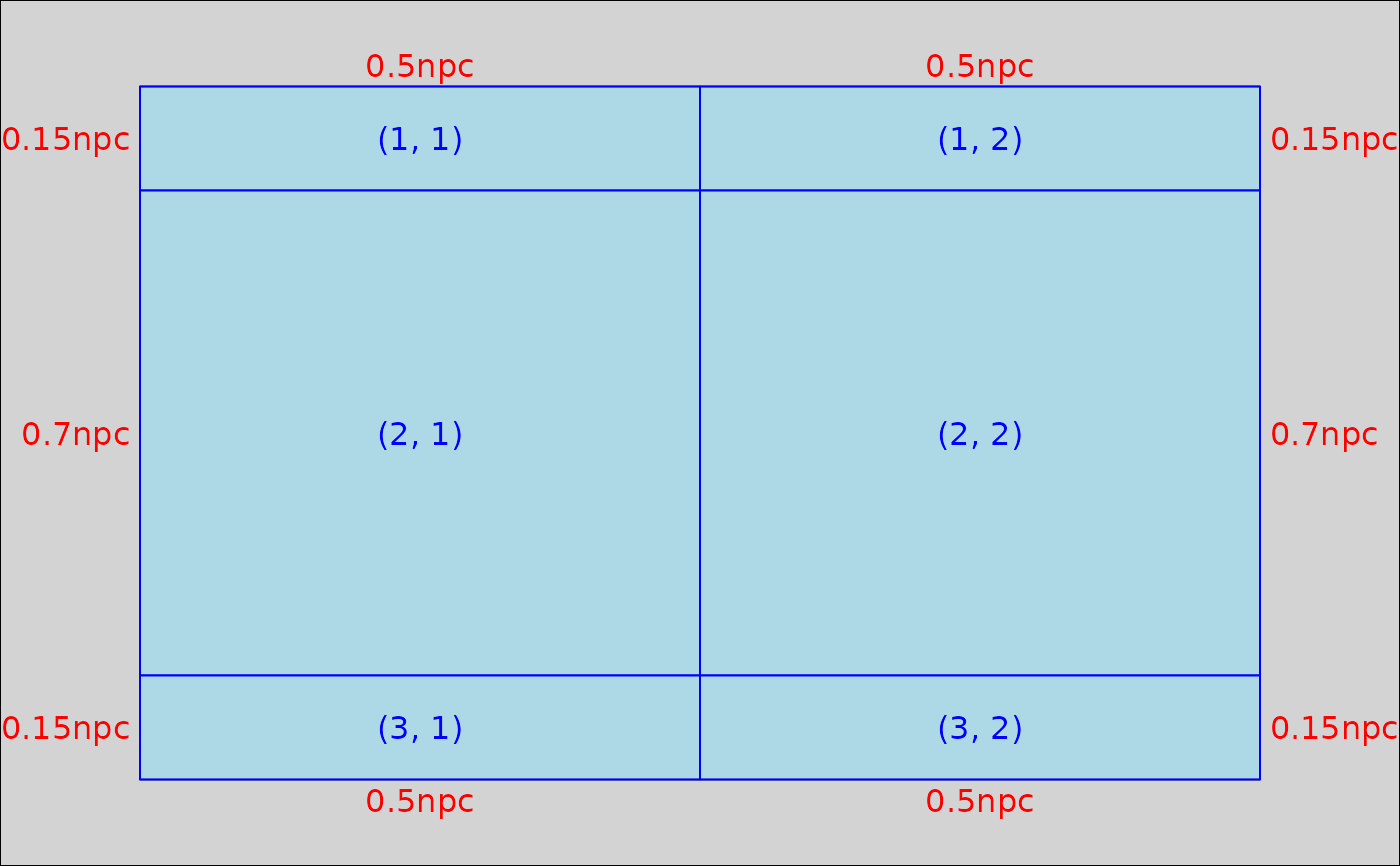
 # Example with a custom layout
custom_layout <- gridifyLayout(
nrow = 3L,
ncol = 2L,
heights = grid::unit(c(0.15, 0.7, 0.15), "npc"),
widths = grid::unit(c(0.5, 0.5), "npc"),
margin = grid::unit(c(t = 0.1, r = 0.1, b = 0.1, l = 0.1), units = "npc"),
global_gpar = grid::gpar(),
adjust_height = FALSE,
object = gridifyObject(row = 2, col = 1),
cells = gridifyCells(header = gridifyCell(
row = 1,
col = 1,
x = 0.5,
y = 0.5,
hjust = 0.5,
vjust = 0.5,
rot = 0,
gpar = grid::gpar()
), footer = gridifyCell(
row = 2,
col = 2,
x = 0.5,
y = 0.5,
hjust = 0.5,
vjust = 0.5,
rot = 0,
gpar = grid::gpar()
))
)
show_layout(custom_layout)
# Example with a custom layout
custom_layout <- gridifyLayout(
nrow = 3L,
ncol = 2L,
heights = grid::unit(c(0.15, 0.7, 0.15), "npc"),
widths = grid::unit(c(0.5, 0.5), "npc"),
margin = grid::unit(c(t = 0.1, r = 0.1, b = 0.1, l = 0.1), units = "npc"),
global_gpar = grid::gpar(),
adjust_height = FALSE,
object = gridifyObject(row = 2, col = 1),
cells = gridifyCells(header = gridifyCell(
row = 1,
col = 1,
x = 0.5,
y = 0.5,
hjust = 0.5,
vjust = 0.5,
rot = 0,
gpar = grid::gpar()
), footer = gridifyCell(
row = 2,
col = 2,
x = 0.5,
y = 0.5,
hjust = 0.5,
vjust = 0.5,
rot = 0,
gpar = grid::gpar()
))
)
show_layout(custom_layout)