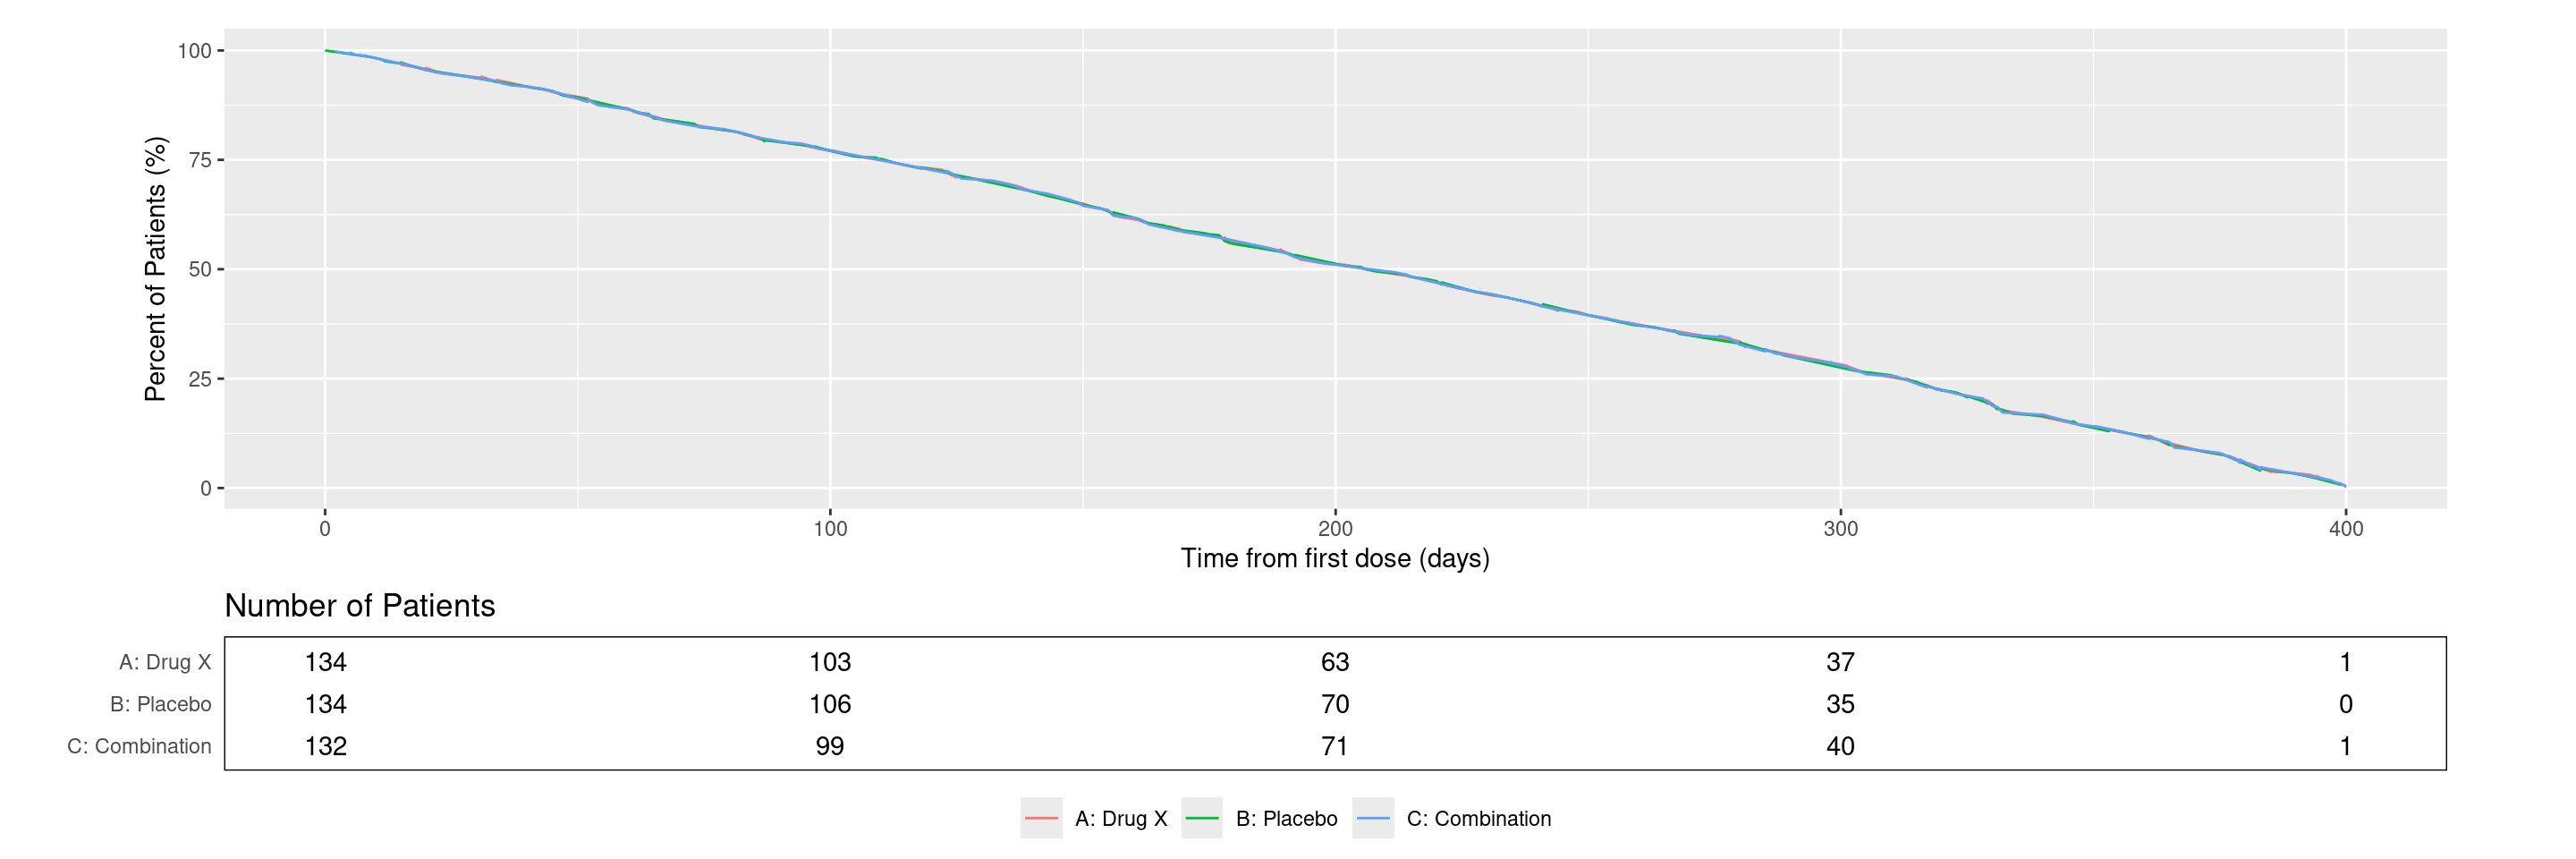
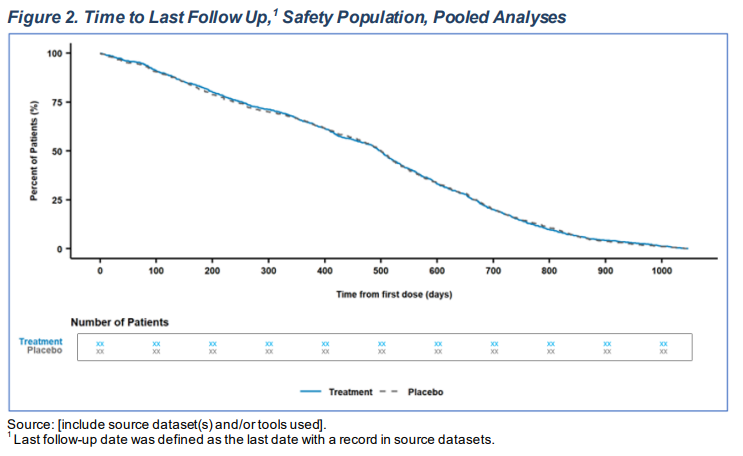
cardinal
  • Home
  • Template Library
    • FDA Table 2
    • FDA Table 3
    • FDA Table 4
    • FDA Table 5
    • FDA Table 6
    • FDA Table 7
    • FDA Table 8
    • FDA Table 9
    • FDA Table 10
    • FDA Table 11
    • FDA Table 12
    • FDA Table 13
    • FDA Table 14
    • FDA Table 15
    • FDA Table 16
    • FDA Table 17
    • FDA Table 18
    • FDA Table 20
    • FDA Table 21
    • FDA Table 22
    • FDA Table 32
    • FDA Table 33
    • FDA Table 34
    • FDA Table 35
    • FDA Table 36
    • FDA Figure 1
    • FDA Figure 2
    • FDA Figure 3
    • FDA Figure 14
  • About
  • Resources
  • Help
    • Getting Started
    • Report a Bug
    • FAQ

FDA Figure 2

Time to Last Follow Up, Safety Population, Pooled Analyses

  • Spec. Screenshot
  • ggplot2 Figure
  • Figure Setup
  • Function Details

# Load Libraries & Data
library(cardinal)

adsl <- random.cdisc.data::cadsl
adsl$EOSDY <- sample(0:400, nrow(adsl), replace = TRUE)

# Output Figure
make_fig_02(df = adsl)

make_fig_02()


Required variables:

  • df: The variables specified by arm_var, id_var, saffl_var, and eosdy_var.
Argument Description Default
df (data.frame) Dataset (typically ADSL) required to build table. No default
arm_var (character) Arm variable used to split table into columns. "ARM"
saffl_var (character) Flag variable used to indicate inclusion in safety population. "SAFFL"
id_var (character) Identifier variable used to count the participants within each flag. "USUBJID"
eosdy_var (character) Variable denoting last recorded (relative) study day. "EOSDY"
u_trtdur (character) Unit for duration of treatment. Options are "days", "weeks", "months" and "years". "days"
x_lab (character) x-axis label. paste0("Time from first dose (", u_trtdur, ")")
y_lab (character) y-axis label. "Percent of Patients (%)"
xticks (vector of numeric) x-axis tick positions. If NA (default), tick mark positions are automatically calculated. NA
add_table (flag) whether “Number of Patients” table should be printed under the plot. TRUE
annotations (named list of character) List of annotations to add to the table. Valid annotation types are title, subtitles, and caption. Each name-value pair should use the annotation type as name and the desired string as value. NULL

Source code for this function is available here.

Source Code
---
title: FDA Figure 2
subtitle: Time to Last Follow Up, Safety Population, Pooled Analyses
format: html
---

::: panel-tabset
## Spec. Screenshot

![](../assets/images/screenshots/fig_02.png){fig-align="center"}

## ggplot2 Figure

```{r fig, message=FALSE, warning=FALSE}
# Load Libraries & Data
library(cardinal)

adsl <- random.cdisc.data::cadsl
adsl$EOSDY <- sample(0:400, nrow(adsl), replace = TRUE)

# Output Figure
make_fig_02(df = adsl)
```

## Figure Setup

```{r fig, eval=FALSE, echo=TRUE}
```

## Function Details

### `make_fig_02()`

------------------------------------------------------------------------

Required variables:

-   **`df`**: The variables specified by `arm_var`, `id_var`, `saffl_var`, and `eosdy_var`.

| **Argument**  | **Description**                                                                                                                                                                                                                     | **Default**                                       |
|:--------------|:------------------------------------------------------------------------------------------------------------------------------------------------------------------------------------------------------------------------------------|:--------------------------------------------------|
| `df`          | (`data.frame`) Dataset (typically ADSL) required to build table.                                                                                                                                                                    | *No default*                                      |
| `arm_var`     | (`character`) Arm variable used to split table into columns.                                                                                                                                                                        | `"ARM"`                                           |
| `saffl_var`   | (`character`) Flag variable used to indicate inclusion in safety population.                                                                                                                                                        | `"SAFFL"`                                         |
| `id_var`      | (`character`) Identifier variable used to count the participants within each flag.                                                                                                                                                  | `"USUBJID"`                                       |
| `eosdy_var`   | (`character`) Variable denoting last recorded (relative) study day.                                                                                                                                                                 | `"EOSDY"`                                         |
| `u_trtdur`    | (`character`) Unit for duration of treatment. Options are `"days"`, `"weeks"`, `"months"` and `"years"`.                                                                                                                            | `"days"`                                          |
| `x_lab`       | (`character`) x-axis label.                                                                                                                                                                                                         | `paste0("Time from first dose (", u_trtdur, ")")` |
| `y_lab`       | (`character`) y-axis label.                                                                                                                                                                                                         | `"Percent of Patients (%)"`                       |
| `xticks`      | (`vector` of `numeric`) x-axis tick positions. If `NA` (default), tick mark positions are automatically calculated.                                                                                                                 | `NA`                                              |
| `add_table`   | (`flag`) whether "Number of Patients" table should be printed under the plot.                                                                                                                                                       | `TRUE`                                            |
| `annotations` | (named `list` of `character`) List of annotations to add to the table. Valid annotation types are `title`, `subtitles`, and `caption`. Each name-value pair should use the annotation type as name and the desired string as value. | `NULL`                                            |

Source code for this function is available [here](https://github.com/pharmaverse/cardinal/blob/main/R/fda-fig_02.R).
:::
 
  • This website as well as code examples are licensed under the Apache License, Version 2.0.
Cookie Preferences